


ZigZag
Information is not investment advice
ZigZag is one of the oldest technical indicators that came to currency trading from the stock market. It allows traders to visualize the structure of the market.
How is the ZigZag indicator work?
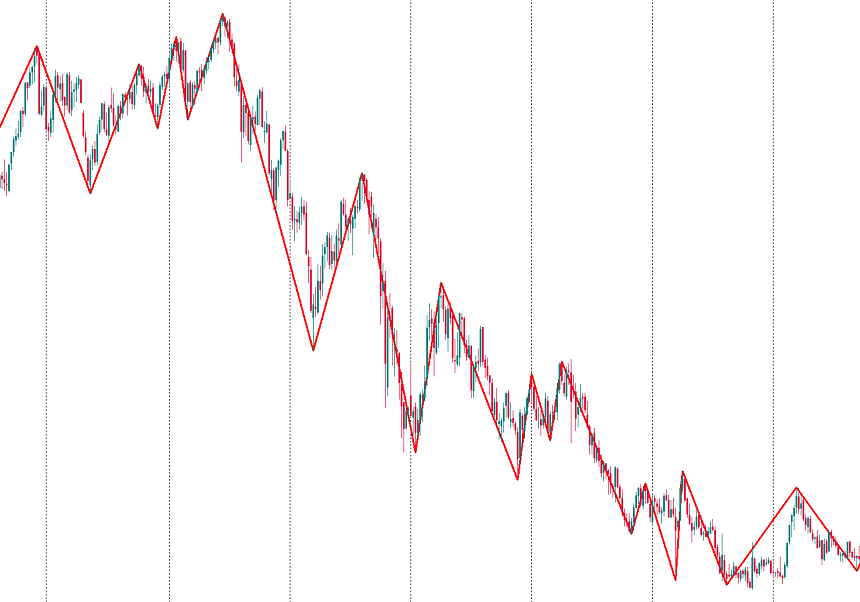
The main purpose of ZigZag is to filter out small and misleading price movements to focus on important swings and trends. ZigZag determines the most significant highs and lows of the price and connects them with straight lines ignoring small fluctuations. ZigZag is not trying to forecast the future price, it only helps to make sense of the past moves of the market.
How to implement
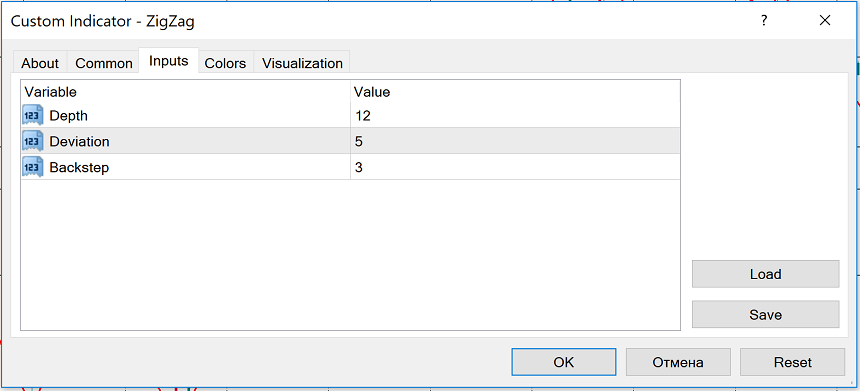
To add the ZigZag indicator to a chart, click “Insert”, choose “Indicators” and then “Custom”. You will then be able to pick out “ZigZag”.The indicator has 3 parameters. They are depth, deviation, and backstep.
Depth is the minimal number of candlesticks which won’t be regarded as a top/bottom if a top/bottom was already found using deviation.
Deviation is the minimal distance (in %) between the highs and the lows of the 2 consecutive candlesticks that will make the indicator form a local top or bottom.
Backstep is the minimal number of candlesticks between local highs or lows.
Below you can see the default parameters for Zigzag in MetaTrader 4. You can adjust the figures making the indicator more/less sensitive to the changes in price. If you reduce the value of the parameters, the number of local highs and lows will increase. As a result, there will be more ZigZag lines on the chart.
Advantages and disadvantages
It’s necessary to use the strong points of ZigZag while reducing the impact of its weak points on your trading.
The main advantages of ZigZag are:
- It shows the most substantial movements of the price and takes the market noise away.
- It works on different timeframes.
- It produces good results when used together with other technical indicators.
The drawbacks of ZigZag are:
- It will mark the latest high or low of the price with a time lag.
- The last stretch of the indicator (the one that involves the current price) may be redrawn.
How to use ZigZag indicator
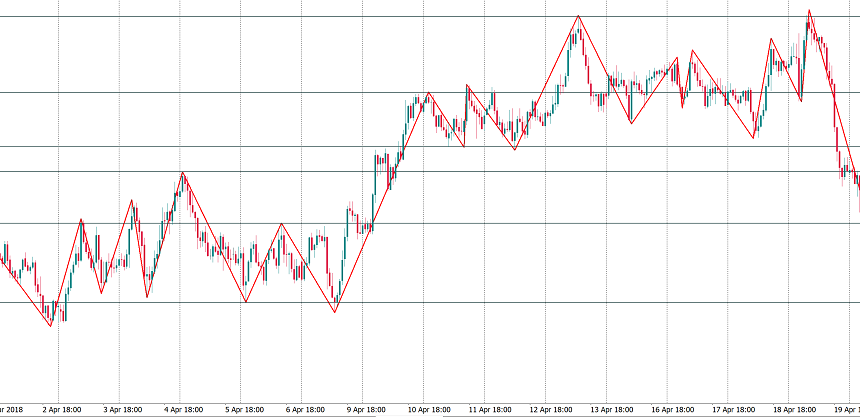
ZigZag marks highs and lows on the chart. It will help you locate support and resistance levels.
ZigZag also makes it easier to identify trends. Higher highs and higher lows mean that there’s an uptrend, while lower highs and lower lows are typical for a downtrend. If you use a trend-following strategy, ZigZag won’t provide you with entry signals, but it will help you decide which signals you are looking for – to buy in an uptrend or to sell in a downtrend. It will also help to find a place for Stop Loss.
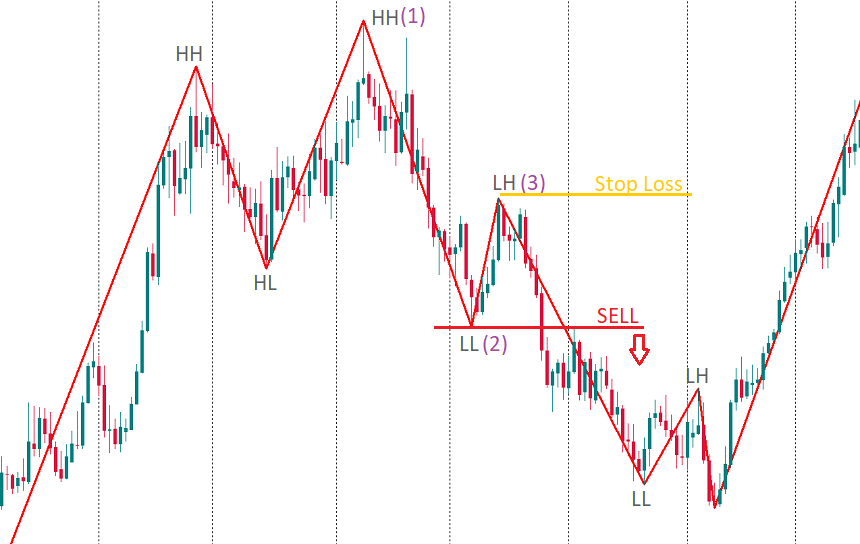
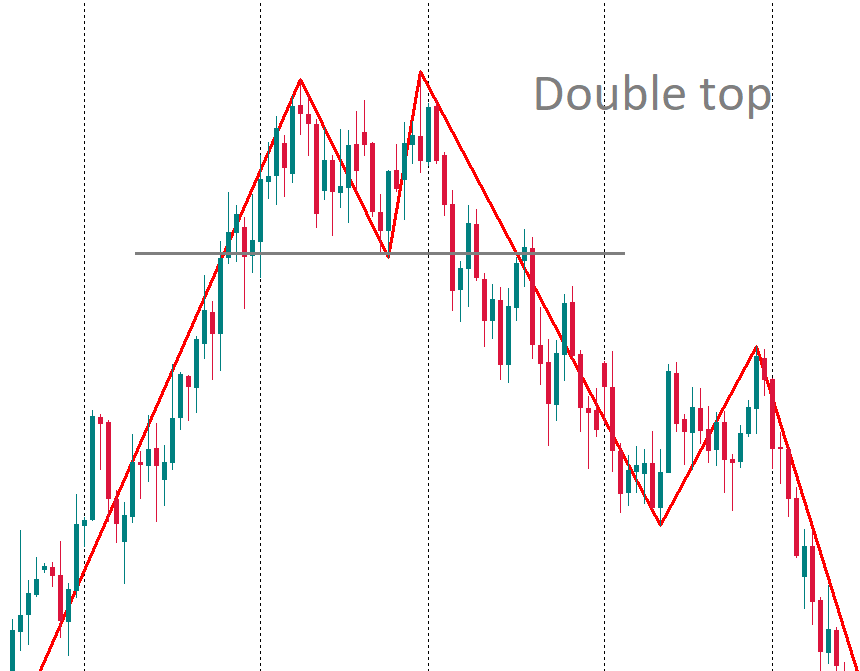
ZigZag also helps to identify chart patterns. Firstly, it allows spotting a 1-2-3 pattern that signals a change in the market’s direction. Moreover, it helps locate “Head and Shoulders”, “Double Tops”, “Flags”, etc.
ZigZag and other tools and indicators
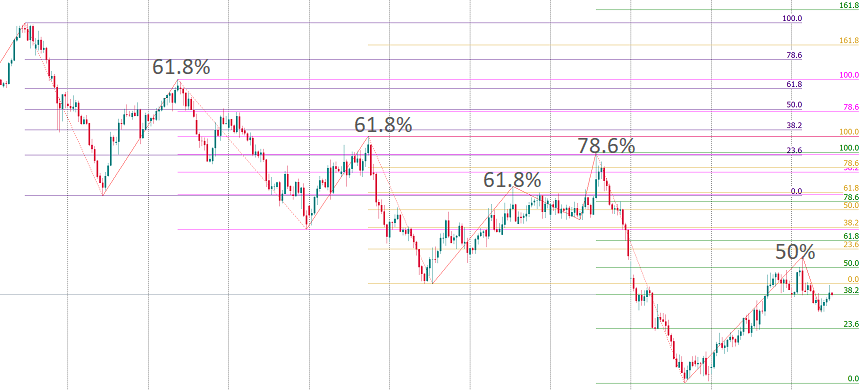
ZigZag indicator is often used together with other tools (Bollinger bands, fractals, Fibonacci, and Elliott waves) to make out price swings.For example, ZigZag plus Fibonacci form a great tool for finding the end of correction within the main trend. Correction usually ends at 38.2%, 50%, or 61.8%. To make your analysis even more precise, you can use oscillators for confirmation.
In brief: ZigZag doesn’t generate trade signals, but it allows to make sense of price trends without getting distracted with market noise. Use it in combination with other tools and indicators.
Other articles in this section
- Timeframes
- Renko charts Japanese candlestick chart
- Types of charts
- Heiken Ashi
- Quantitative easing policy
- Pivot Points
- Moving Average
- Williams’ Percent Range (%R)
- Relative Vigor Index (RVI indicator)
- Momentum
- Force index
- Envelopes
- Bulls Power and Bears Power
- Average True Range
- How to trade on central bank decisions?
- CCI (Commodity Channel Index)
- Parabolic SAR
- Stochastic Oscillator
- Relative Strength Index
- Oscillators
- ADX indicator
- Bollinger bands
- Trend indicators
- Introduction to technical indicators
- Support and resistance
- Trend
- Technical analysis
- Central Banks: policy and effects
- Fundamental factors
- Fundamental analysis
- Fundamental vs technical analysis
Choose your payment system


