


Relative Strength Index
Information is not investment advice
Relative Strength Index, or RSI, is one of the most popular technical indicators among traders. It was developed by J. Welles Wilder in 1978 to measure the speed and the change of price movements. The indicator also helps to determine the overbought/oversold state of the market in order to buy low and sell high.
How to implement RSI
To add the RSI to a chart, click “Insert” – “Indicators” – “Oscillators” – and you will see the "Relative Strength Index".
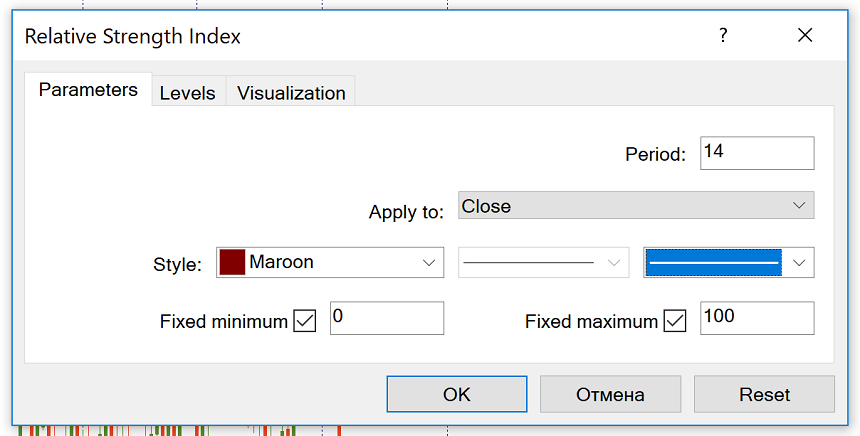
By default, MetaTrader will offer you to have “14” as the number of periods. You can change this parameter if you want to. Short-term traders normally use 9-period RSI, while those who prefer longer-term trades choose 25-period RSI. All in all, the smaller the period, the more fluctuations the indicator will make.
How to interpret Relative Strength Index
The readings of the indicator fluctuate between 0 and 100. You can also add a middle line at 50. If the RSI is above this point, momentum is considered up and there’s more sense to look for opportunities to buy. When the RSI drops below 50, it’s a sign of a new bearish market trend, so consider opening sell trades.
The market is overbought or oversold
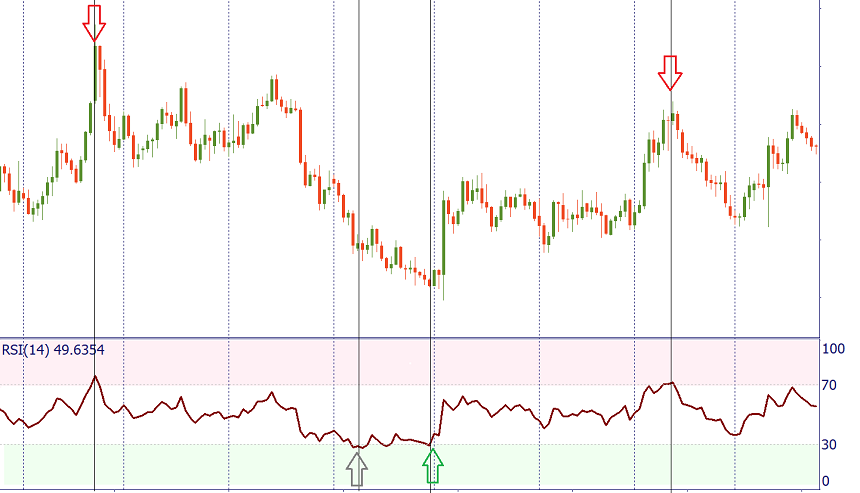
Like other oscillators, the RSI helps to tell when the asset is overbought or oversold. For the RSI, you need to watch the levels of 70 and 30. If the RSI rises above 70 bound, it means that the market is overbought and may correct down. If the RSI falls below the 30 line – the asset is oversold and may retrace to higher levels.
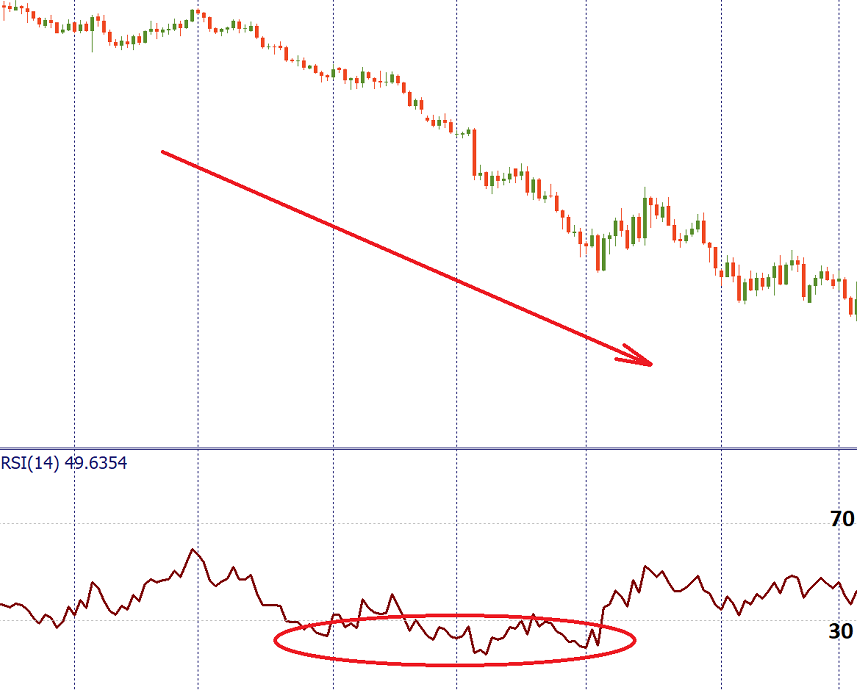
Notice, however, that this approach is not suitable for trading in strong trends when the RSI may stay overbought or oversold for long periods of time. If you have evidence that there’s a strong trend in the market, consider selling when RSI is oversold in a downtrend, and buying when RSI is overbought in an uptrend.
All in all, the quality of RSI signals increases when you follow only those signals that are in the direction of the trend when the indicator leaves critical levels. For example, you can buy during an uptrend when RSI gets above 30.
The market reversal
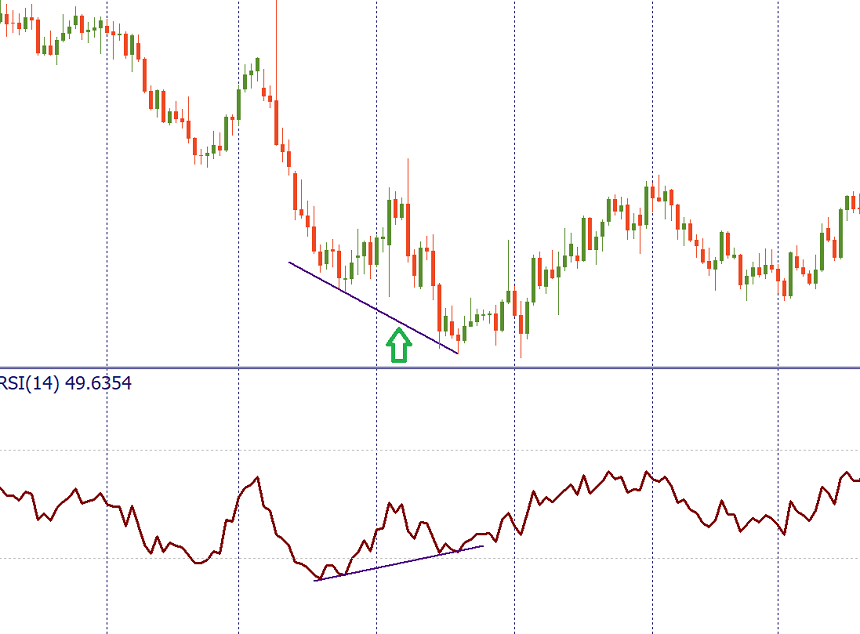
Moreover, the divergence between RSI and price may warn of the market reversal. When the new high of the price is not confirmed by the new high in the RSI, it’s a bearish divergence, which is a negative signal. When the price forms a lower low but the minimum of RSI is higher than the previous one, it’s a divergence in favor of bulls.
The RSI is often used in combination with another oscillator, the MACD. While the RSI measures price change in relation to recent price highs and lows, the MACD measures the relationship between two EMAs. Together the RSI and the MACD represent a powerful combo.
Conclusion
A competent trader should know what the RSI is and how to use it. Make sure that your analysis isn’t built solely on RSI but comprises the study of price action as well as other technical indicators. Remember that the signals of the Relative Strength Index are most reliable when they conform to the long-term trend.
Other articles in this section
- Timeframes
- Renko charts Japanese candlestick chart
- Types of charts
- Heiken Ashi
- Quantitative easing policy
- Pivot Points
- ZigZag
- Moving Average
- Williams’ Percent Range (%R)
- Momentum
- Envelopes
- Bulls Power and Bears Power
- Average True Range
- How to trade on central bank decisions?
- Parabolic SAR
- Stochastic Oscillator
- Oscillators
- ADX indicator
- Bollinger bands
- Trend indicators
- Introduction to technical indicators
- Support and resistance
- Trend
- Technical analysis
- Central Banks: policy and effects
- Fundamental factors
- Fundamental analysis
- Fundamental vs technical analysis
Choose your payment system


