Fundamental vs technical analysis
Information is not investment advice
There are some topics that spark never-ending debate and sow discord among people. What to buy – iPhone or Android? Which football team to support – Manchester United or Liverpool? You might have noticed that there is no clear-cut answer to these questions. As the old saying goes: tastes differ. Every man to his taste: the one man’s meat is another man’s poison. OK, there are many variations of this saying, we’d better proceed to our actual topic. What we wanted to say is that traders have their own eternal debate about the best way to make profits in the financial markets.
Technical
Some traders consider themselves to be “technical traders”. They rely on the price movement patterns and technical tools in their analysis and don’t pay much heed to the economic news flow. The only thing that matters, according to them, is the price of the currency/financial asset. Other things are just distractors.
Fundamental
Another team of traders disagrees with these “technicians” and advocates the fundamental way of market analysis. These guys scrutinize macroeconomic releases, pay attention to the news to unravel the future direction of the market – they are the adherers of fundamental analysis.
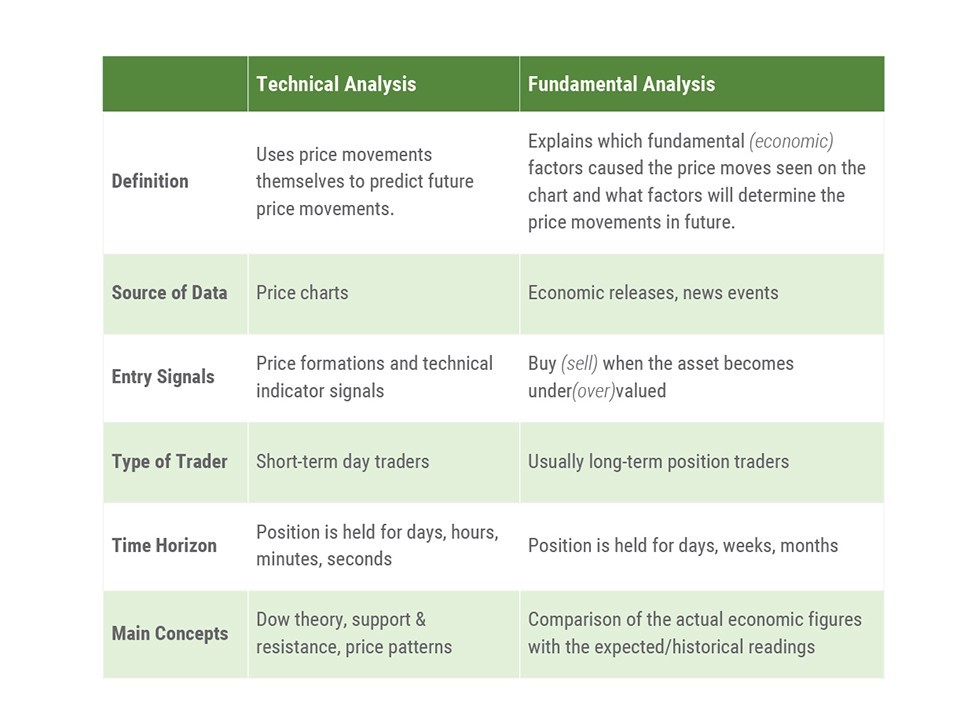
The first group of people is generally made of swing traders and short-term day traders who take positions for a day, several hours, minutes, or even seconds. Another group of traders acts more strategically; they prefer holding positions for days, weeks, or even months. They are the people of the virile, very strong character.
Comparison of analysis types in the table

Both fundamental and technical analysis have their advantages and drawbacks, so it’s best to combine these 2 methods. This way you will get the fullest view of what is happening at the market. While trading on the intraday use technical analysis first to determine the state of the market, trade entry and exit levels. Then use fundamental analysis to adjust your strategy taking into account events of the economic calendar. In the longer-term trade firstly determine the trend with the help of fundamental analysis and then look for an entry and exit point using technical analysis tools.
You will learn more about fundamental and technical analysis from this course.
Other articles in this section
- Timeframes
- Renko charts Japanese candlestick chart
- Types of charts
- Heiken Ashi
- Quantitative easing policy
- Pivot Points
- ZigZag
- Moving Average
- Williams’ Percent Range (%R)
- Relative Vigor Index (RVI indicator)
- Momentum
- Force index
- Envelopes
- Bulls Power and Bears Power
- Average True Range
- How to trade on central bank decisions?
- CCI (Commodity Channel Index)
- Parabolic SAR
- Stochastic Oscillator
- Relative Strength Index
- Oscillators
- ADX indicator
- Bollinger bands
- Trend indicators
- Support and resistance
- Trend
- Central Banks: policy and effects


