


Force index
Information is not investment advice
Force Index (FI) is another indicator developed by Alexander Elder. It measures the force of bears and bulls in a trending market. This indicator is based on price, direction and trade volumes, which are, according to Elder, the three essential elements of the price’s movement.
The FI can confirm a trend, identify corrections that are worth trading and even foresee the reversals.
How to implement
The Force Index is included in the default set of MetaTrader. You can add it to the chart by clicking “Insert” – “Indicators” – “Oscillators” and then choosing “Force Index”.
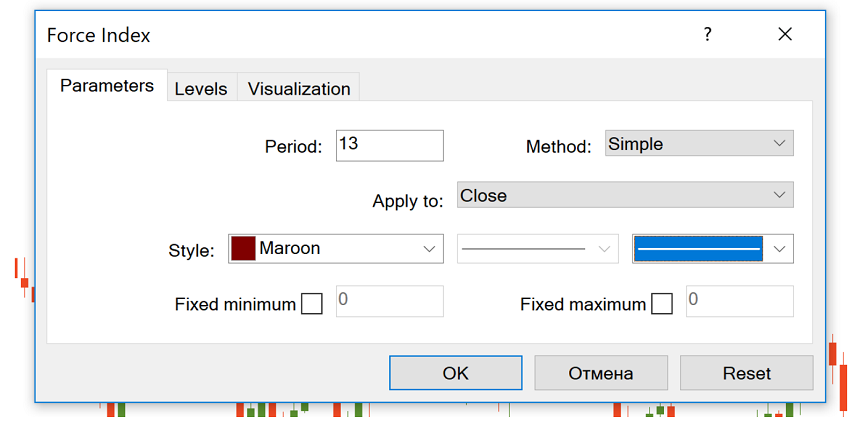
The FI is calculated the following way: the previous closing price is subtracted from the current close and multiplied by volume. Then an exponential moving average is applied to the resulting value so that you not a histogram but a line in the indicator’s window. The FI may be smoothed by a short-term (2-10 periods) or long-term (13 periods) MA.
How to interpret
If the current closing price is higher than the previous one, the index will be positive. When the indicator rises, it shows bulls’ force. Vice versa, if the closing price is lower than the previous one, the indicator will be negative showing the bears’ force. As a result, it’s worth watching the moments when the FI crosses the zero line.
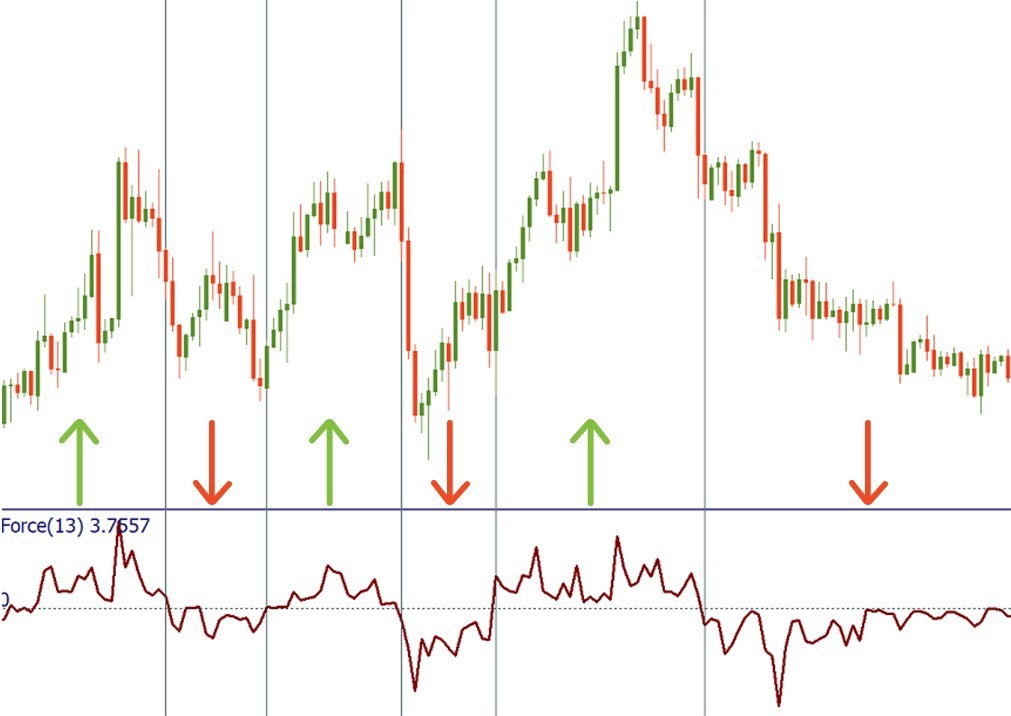
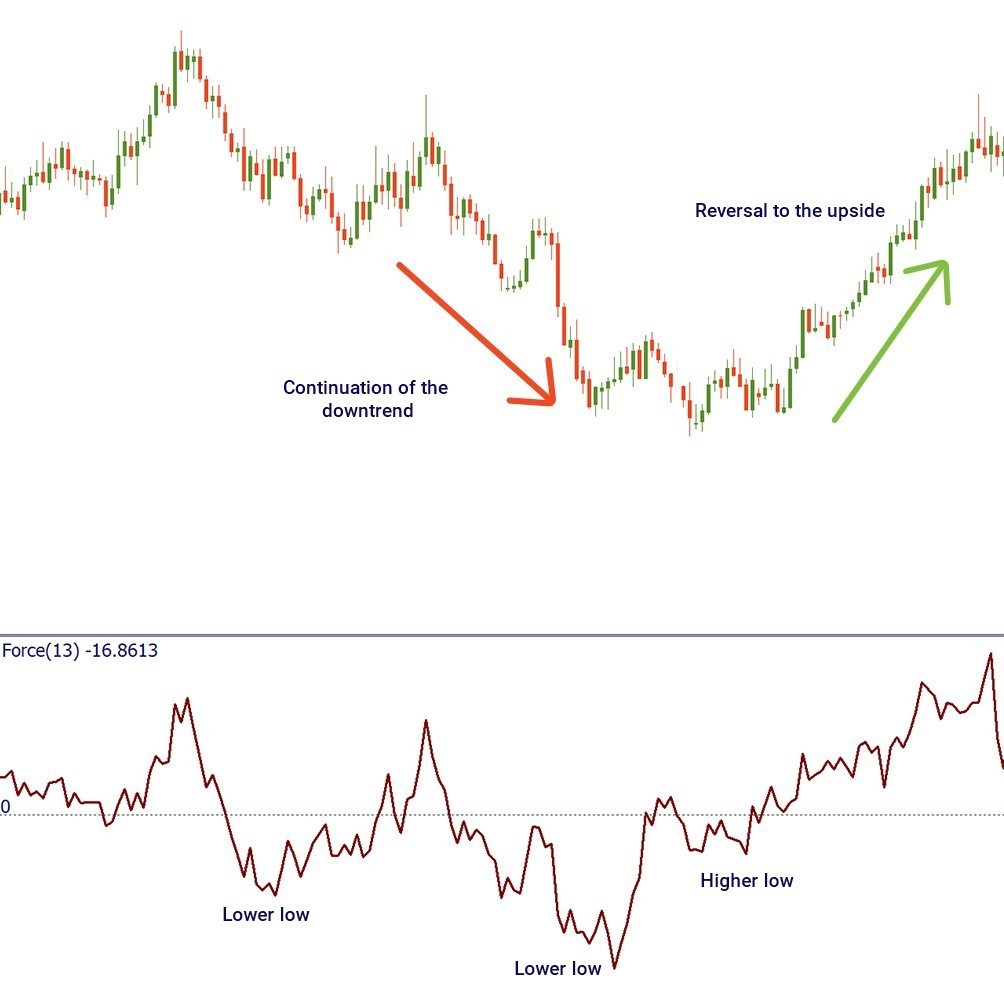
In addition, the indicator also comprises the volume data. This allows making a better judgment about a trend and its momentum. When the Force Index gets to a new high, the current uptrend is likely to continue. When FI slides to a new low, the downtrend will go on. When the FI gets to a higher low, the trend may reverse up.
If a trend is strong, the force index will change sharply. More likely, it will signal the continuation of a trend. At the same time, if prices change by inertia, the FI will change only slightly. If the current price increases but the indicator is not, it means that the uptrend weakens.
Below we gathered various signals provided by the Force Index. Use them wisely and remember that confirmation from other tools is always welcome.
Bullish signals produced by the FI:
- Force Index is printing new highs in a rising trend (trend continuation).
- Forces Index falls below zero in the period of a rising trend (buy on dips).
- Force Index rises above zero in a downtrend (buy on correction counter the main trend).
- Force Index crosses the MA to the upside (if you apply a MA to the indicator).
- Divergences (price prints lower lows but FI makes higher lows).
Bearish signals produced by the FI:
- Force Index is printing new lows in a downtrend (trend continuation).
- Force Index rises above zero in the period of a downward trend (sell on pullbacks).
- Force index drops below zero in an uptrend (sell on correction counter the main trend).
- Force index crosses the MA to the downside (if you apply a MA to the indicator).
- Divergences (price prints higher highs when FI makes lower highs).
To make a conclusion, the Force Index is considered one of the best combinations of price and volume. Notice that in currency trading, the FI uses the tick volume data, which corresponds to the number of transactions, so some distortions are possible. The Force Index shows the best results when applied to volatile markets.
Other articles in this section
- Timeframes
- Renko charts Japanese candlestick chart
- Types of charts
- Heiken Ashi
- Quantitative easing policy
- Pivot Points
- ZigZag
- Moving Average
- Williams’ Percent Range (%R)
- Momentum
- Envelopes
- Bulls Power and Bears Power
- Average True Range
- How to trade on central bank decisions?
- Parabolic SAR
- Stochastic Oscillator
- Oscillators
- ADX indicator
- Bollinger bands
- Trend indicators
- Introduction to technical indicators
- Support and resistance
- Trend
- Technical analysis
- Central Banks: policy and effects
- Fundamental factors
- Fundamental analysis
- Fundamental vs technical analysis
Choose your payment system


