


Heiken Ashi
Information is not investment advice
The Heiken Ashi indicator represents a specific type of candlesticks which differ from those we are used to seeing at the Japanese candlestick chart. “Heiken Ashi” can be translated from Japanese as “a bar in the middle”. This approach was developed back in the 1700s by Munehisa Homma.
How the Heiken Ashi indicator works
The main aim of this indicator is to filter out market noise. As you remember, Japanese candlesticks simply visualize the price’s opening, closing, highest and lowest levels during a particular period of time. The Heiken Ashi has a specific formula in place:
Heikin-Ashi Open = [Open (previous bar) + Close (previous bar)]/2
Heikin-Ashi Close = (Open+High+Low+Close)/4
Heikin-Ashi High = Max (High, Open or Close)
Heikin-Ashi Low = Min (Low, Open or Close)
The indicator, of course, counts everything automatically. Yet, you need to understand where the Heiken Ashi candlesticks come from and realize that if the Heiken Ashi spiked, it doesn’t mean that the price actually visited that level. The indicator simply shows the trend.
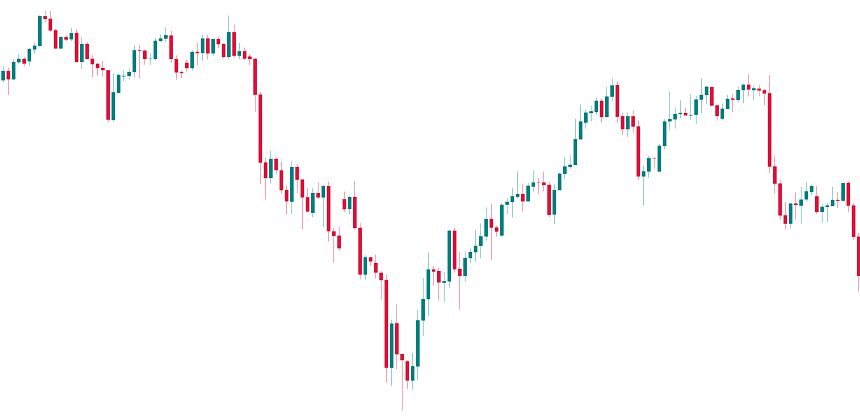
Here's a usual Japanese candlestick chart:
And here are Heiken Ashi candlesticks for the same period of time (the price chart itself is in the form of a line chart):
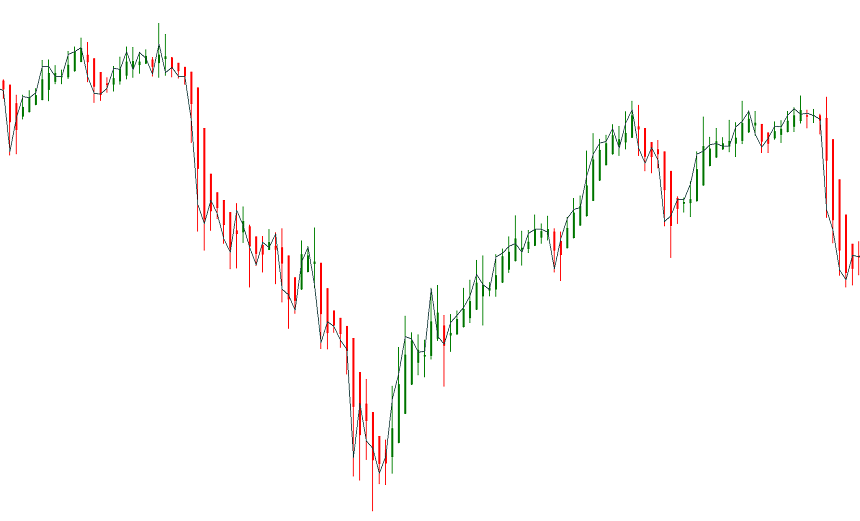
If you compare the simple candlestick chart with the Heiken Ashi, the latter looks smoother because it takes an average of the price movement. Notice that Heiken Ashi candlesticks tend to have a bullish color (whichever you choose in the settings – let’s make it green) during an uptrend, and a bearish color during a downtrend (let it be red). The current price of the Heiken Ashi may differ from the current price of a financial asset you are trading. There also are no gaps in the Heiken Ashi chart.
How to implement
To add the Heiken Ashi indicator to a chart, click “Insert”, choose “Indicators” and then “Custom”. You will then be able to pick out “Heiken Ashi”.
How to trade using Heiken Ashi
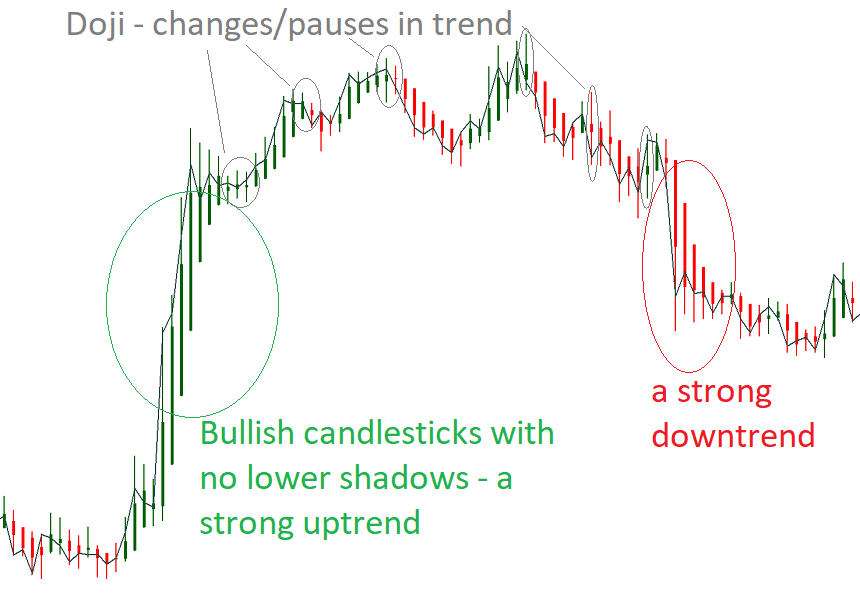
It’s possible to tell a lot about the market by observing Heiken Ashi candlesticks:
- Bullish candlesticks with no lower shadows signal a strong uptrend.
- Bearish candlesticks with no upper shadows point at a strong downtrend.
- Candlesticks having a small body and both upper and lower shadows (doji) are signs of a change in trend.
The Heiken Ashi indicator may be used for several purposes:
- To measure a trend’s strength. If a trend is strong, a trader can hold to it and benefit from trading in its direction.
- To identify reversal. A moment of reversal in a trend allows to close the previous trend-following trade or to get in on a new trend.
Heiken Ashi with other indicators
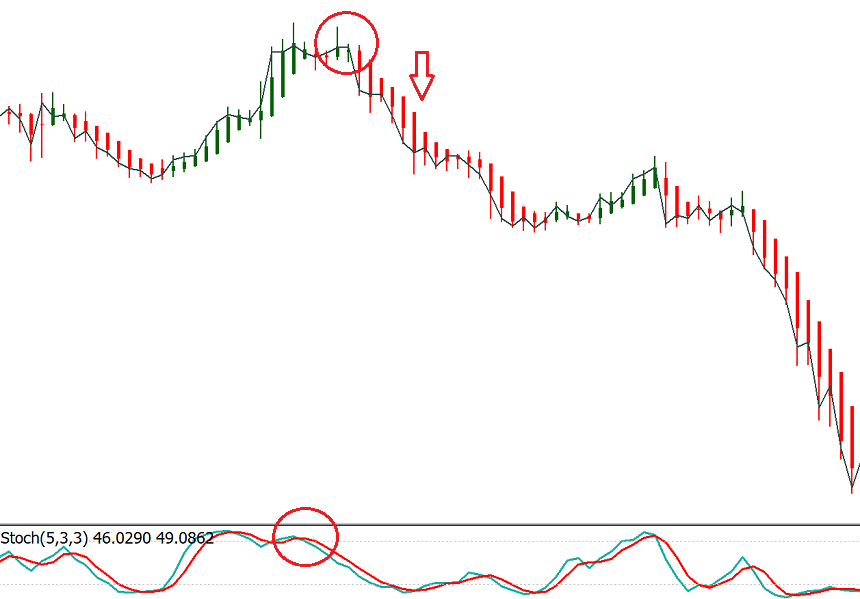
It’s recommended to use the Heiken Ashi together with other indicators, for example, the Stochastic Oscillator. A simple trading strategy involving these two indicators presumes to open a buy trade when the Stochastic exits the oversold area and there’s a reversal candlestick at Heiken Ashi. According to the same logic, a sell trade should be opened when the Stochastic leaves the overbought area and there’s a bearish reversal at Heiken Ashi. You can see the example of the sell signals from the Heiken Ashi and the Stochastic Oscillator on the chart below:
Support and Resistance levels
It’s also possible to define support and resistance levels on the Heiken Ashi chart, as well as price and chart patterns.
Timeframes. If you are an intraday trader, use the Heiken Ashi at timeframes from M5 to H1. If you are a swing trader and hold the position open for several days, you can use Heiken Ashi at H4 and D1.
Currency pairs. You can use the Heiken Ashi for any currency pairs, but the best results can be achieved at the pairs which have the JPY in them (EUR/JPY, GBP/JPY, CAD/JPY) as they tend to be more volatile.
Advantages and disadvantages
The key advantage of the Heiken Ashi is that it filters out the bad signals (market noise) and makes it easier for traders to spot good trade signals. As a result, market analysis becomes easier.
The drawback of the Heiken Ashi indicator is that it lags behind the price. This is natural as the indicator needs the price to form highs, lows and close in order to compute its readings.
In brief: The Heiken Ashi is a powerful analytical tool. It allows traders to focus on the best entry signals as well as ride the trends as long as possible. Use Heiken Ashi together with other technical indicators as well as the price action analysis.
Other articles in this section
- Timeframes
- Renko charts Japanese candlestick chart
- Types of charts
- Quantitative easing policy
- Pivot Points
- ZigZag
- Moving Average
- Williams’ Percent Range (%R)
- Relative Vigor Index (RVI indicator)
- Momentum
- Force index
- Envelopes
- Bulls Power and Bears Power
- Average True Range
- How to trade on central bank decisions?
- CCI (Commodity Channel Index)
- Parabolic SAR
- Stochastic Oscillator
- Relative Strength Index
- Oscillators
- ADX indicator
- Bollinger bands
- Trend indicators
- Introduction to technical indicators
- Support and resistance
- Trend
- Technical analysis
- Central Banks: policy and effects
- Fundamental factors
- Fundamental analysis
- Fundamental vs technical analysis
Choose your payment system


