


Average True Range
Information is not investment advice
Average True Range (ATR) is an indicator of the market’s volatility. It shows how much an asset moves, on average, over a given time frame. In other words, it helps to determine the average size of the daily trading range. The indicator was developed by J. Welles Wilder Jr. in his book, New Concepts in Technical Trading Systems.
About ATR indicator
The indicator is calculated on the basis of the so-called true ranges. It uses the absolute value of the current high less the previous close or the absolute value of the current low less the previous close. The ATR represents a moving average of these ranges.
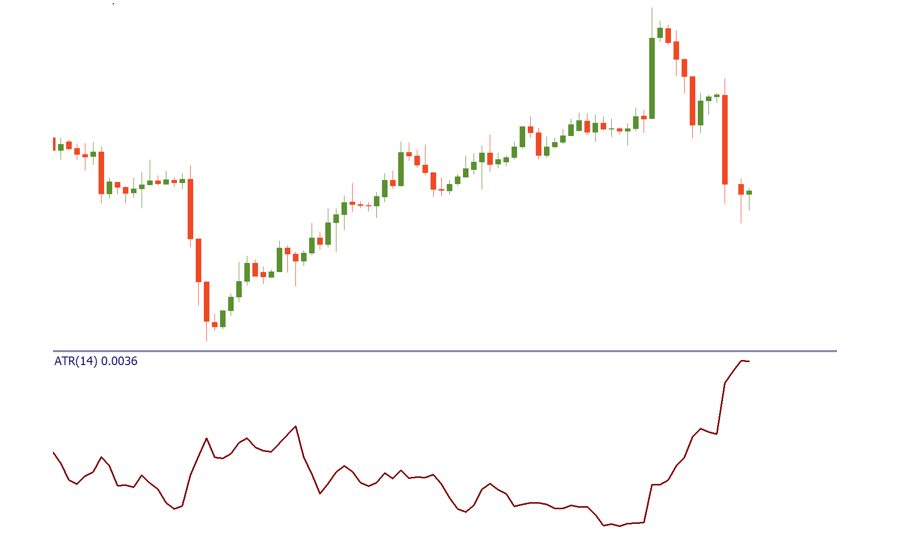
ATR rises when trading is more volatile (price bars are long) and falls during periods of low volatility (price bars are short). The ATR is often used to determine the best position for stop-loss orders.
How to implement
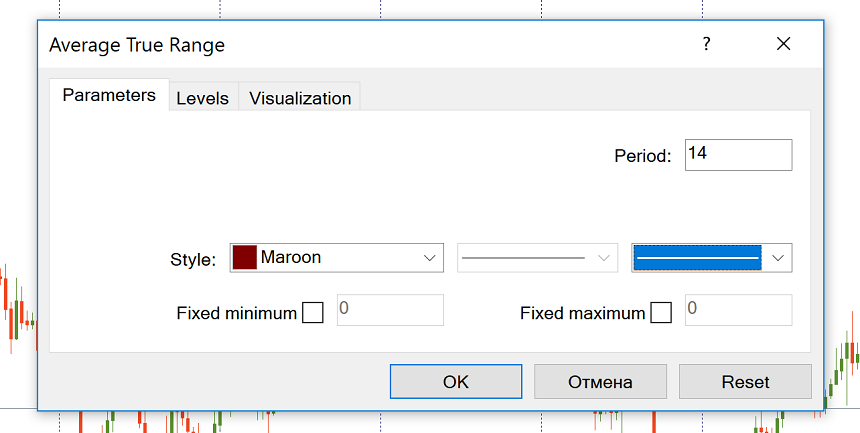
The ATR belongs to the default set of MetaTrader. You can add it to the chart by clicking “Insert” – “Indicators” – “Oscillator” and then choosing “ATR”.
By default, MetaTrader will offer you to have “14” as the number of periods. If you choose a smaller number, the indicator will generate more trading signals, although the number of false signals will also increase. If you opt for a bigger number, the number of trading signals will likely decline.
ATR can be used on any timeframe that is bigger than H1.
How to interpret
As we pointed out before, the Average True Range has two important applications. Let’s delve into them.
Notice that in Metatrader, the indicator will show pips, so the ATR reading of 0.0025 means 25 pips.
Using ATR as a filter in trading
The indicator can be used as a filter of a trend. The higher the value of the indicator is, the higher the probability of a trend’s change is. The lower the indicator’s value is, the weaker the trend’s movement is.
To analyze trends with ATR you will need a central line. When the indicator breaks it, the most significant moves of the market take place. There is no particular central line for this indicator, so it is estimated by the eye. As an option, you can use a moving average with a big period like 100. To do this, choose “Moving Average” among MT4’s trend indicators in the “Navigator” panel, and then drag and drop it into the ATR indicator chart. In the window that pops up, choose “First Indicator’s Data” from the “Apply to” dropdown menu of the “Parameters” tab.
When the indicator is below the moving average, the market is calm. When the ATR breaks the moving average, a trend starts.
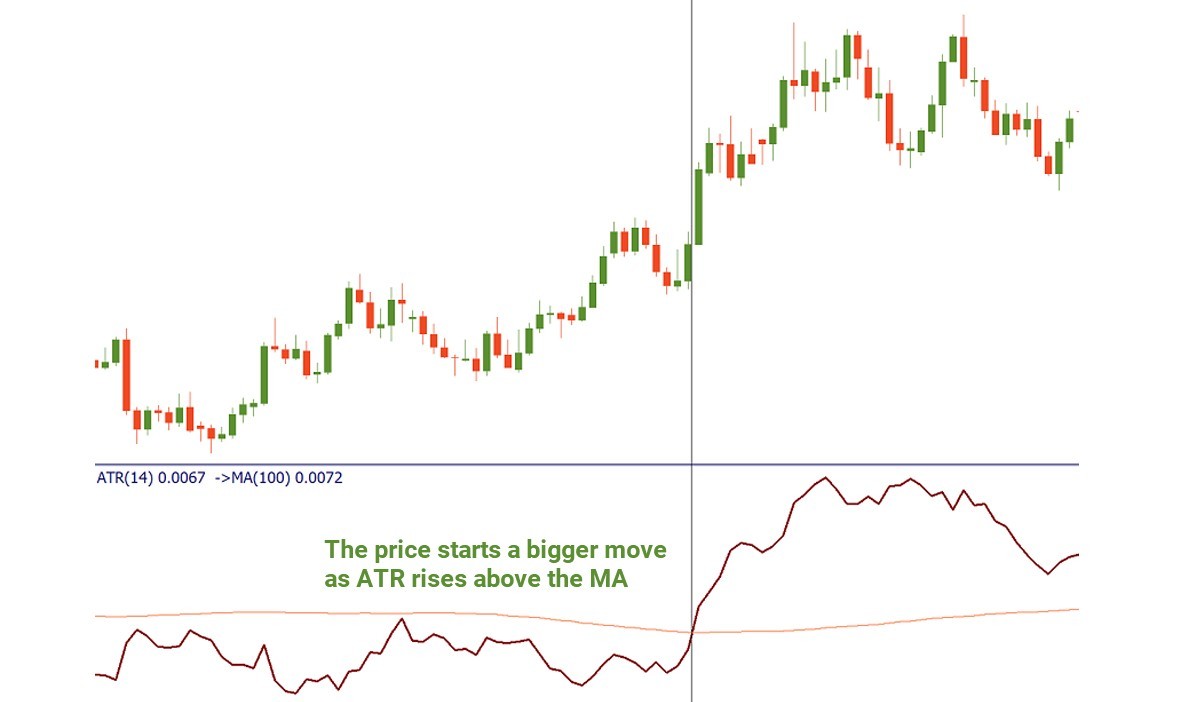
To confirm the trend, it is worth to implement the indicator on several time frames, for example, on D1 and H1. If they move in the same direction and the ATR line breaks its moving average on the smaller time frame, it means that the market becomes animated.
It’s also a good idea to apply the indicator Envelopes to ATR. The logic is the same. If the latter is below the Envelopes’ lines, volatility is low. A break to the upside signals that the price action has become more intense.
Finally, the ATR can tell you whether there’s a sense to trade. If the indicator value is bigger than, let’s say, 20, the market is probably experiencing some extreme conditions. Usually, this happens when an important piece of news is out. If the ATR reading is smaller than 10, the price probably staggers, the candlesticks are small and hence the profit potential is limited. If you see that the market has already made a move equal to or exceeding daily ATR, the odds are that it won’t move much in that direction during the same day. As a result, it’s probably not the best time to bet on the continuation of the movement. On the contrary, there may be sensible to look for the signals in the opposite direction.
Using ATR to exit the market.
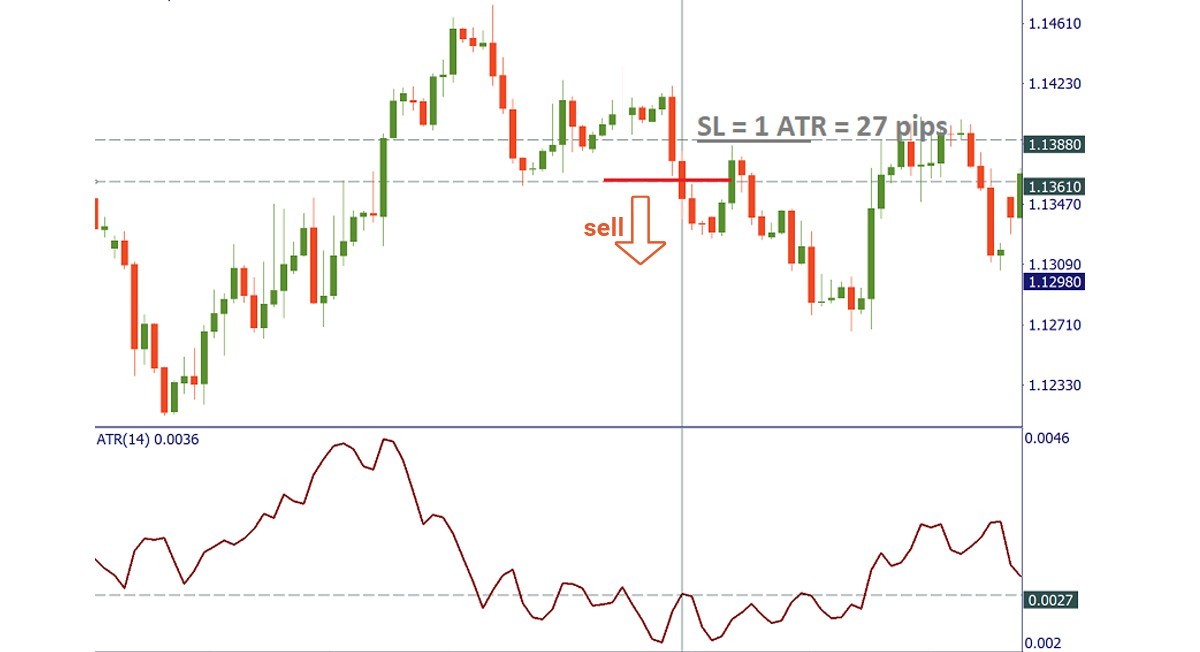
The ATR helps traders to set stop-loss orders that take into account market volatility. That applies both for static and trailing stop-loss orders.
When the market is volatile, one should set wider stops in order to avoid being stopped out of the trading by some random market noise. When the volatility is low, one may set tighter stops. It’s recommended to set stops equal to 1-4 times of ATR value.
As for trailing stops, you place a stop loss at 2 x ATR below the entry price if buying, or 2 x ATR above the entry price if shorting. There’s also a so-called “chandelier exit” when a stop loss is placed under the highest high the price reached since you entered the buy trade. The distance between the highest high and the stop level is defined as some multiple times the ATR. For example, we can subtract three times the value of the ATR from the highest high since we entered the trade.
Conclusion.
ATR is commonly used in creating automated trading systems. It helps to build filters that take into account volatility or adapt different variables to the market. Those who trade manually often underestimate the benefits of the Average True Range indicator. Yet, it can do your trading a lot of good by making it more precise.
Other articles in this section
- Timeframes
- Renko charts Japanese candlestick chart
- Types of charts
- Heiken Ashi
- Quantitative easing policy
- Pivot Points
- ZigZag
- Relative Vigor Index (RVI indicator)
- Momentum
- Force index
- Envelopes
- Bulls Power and Bears Power
- How to trade on central bank decisions?
- CCI (Commodity Channel Index)
- Parabolic SAR
- Stochastic Oscillator
- Relative Strength Index
- Oscillators
- ADX indicator
- Bollinger bands
- Trend indicators
- Introduction to technical indicators
- Support and resistance
- Trend
- Technical analysis
- Central Banks: policy and effects
- Fundamental factors
- Fundamental analysis
- Fundamental vs technical analysis
Choose your payment system


