


Williams’ Percent Range (%R)
Information is not investment advice
Williams Percent Range, or %R for short, is a technical indicator developed by Larry Williams in 1973. This is a simple, but efficient oscillator which shows the speed with which the price is moving.
How to implement
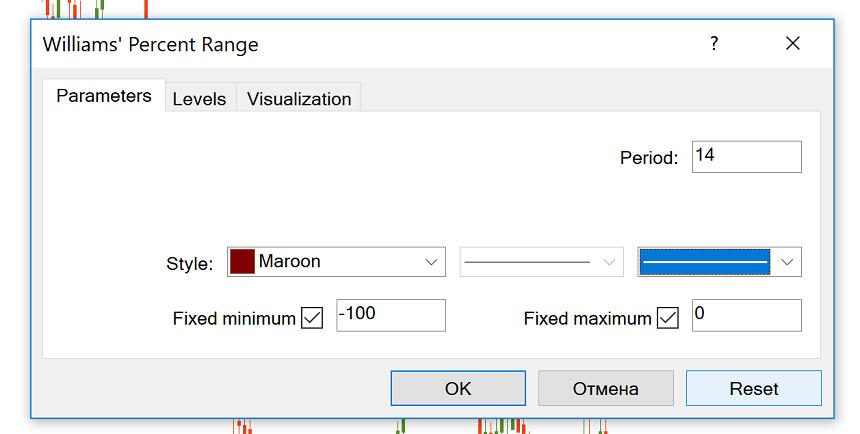
%R is included in the default set of MetaTrader indicators, so you don’t need to download it. Go to “Insert” – “Indicators” – “Oscillators” – and you will see the Williams’ Percent Range.
By default, the indicator’s period is 14. You can change this parameter if necessary.
How to interpret % R indicator
Williams %R is a momentum oscillator. It resembles the Stochastic Oscillator a lot. The difference between them is that Stochastic compares open and close prices of different periods, while Williams R indicator uses only the closing price and compares it with the high-low range over a specific period.
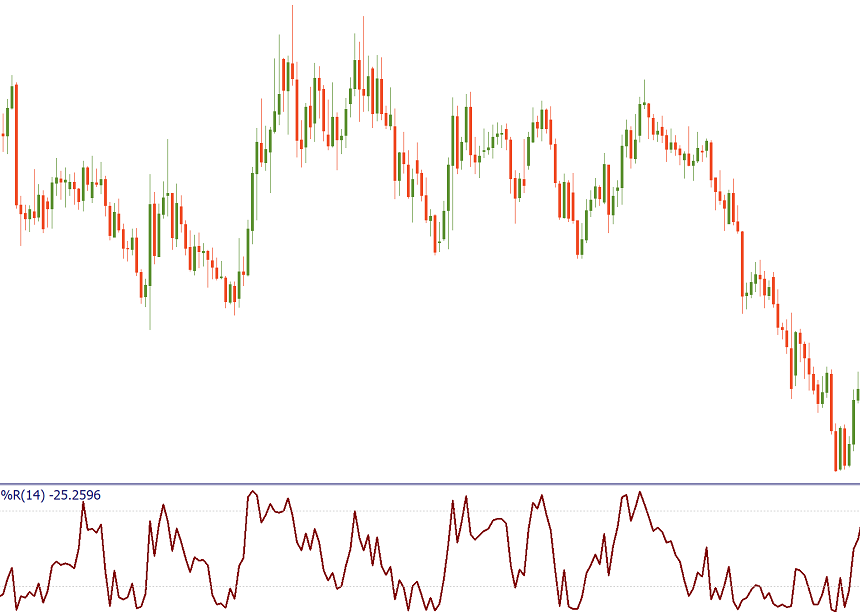
Unlike the Stochastics oscillator, the Williams % R is not graded from down to up but from up to down. This means that the lower indicator values are found at the upper part of the indicator window and the figures increase in descending order as the indicator line moves from up to down. Therefore the 0 level is located at the top, and the – 100 value is located below.
%R shows when the market is overbought or oversold. If %R is between -100 and -80, the market is oversold and one should start thinking of buying. If %R is between 0 and -20, the market is overbought and one should start thinking of selling.
Notice though that an overbought or oversold reading doesn't mean the price will reverse. Overbought simply means the price is near the highs of its recent range, and oversold means the price is in the lower end of its recent range. As a result, it’s not recommended to use this kind of signal as our only hint for the market entry. Remember that this indicator requires a confirmation from price action or other tools of technical analysis.
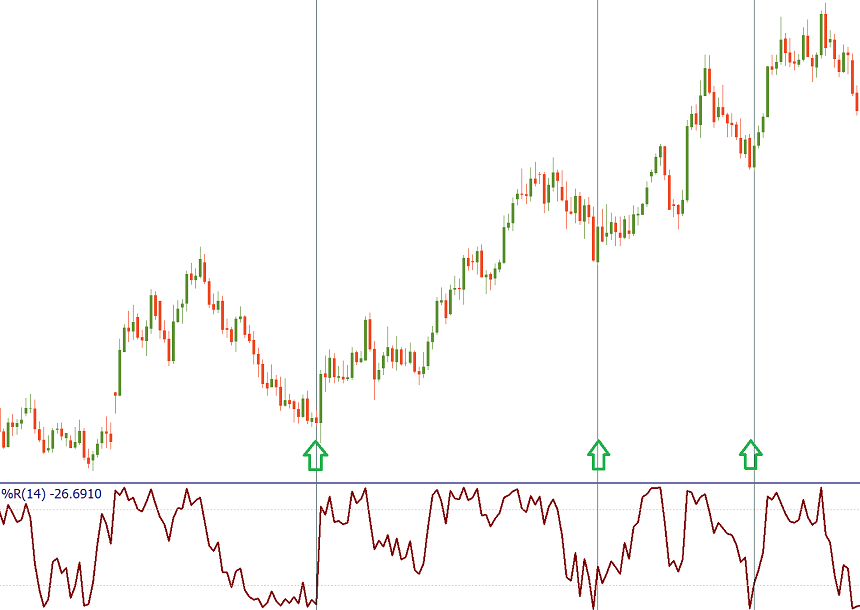
One of the simplest and yet efficient filters is to look for a situation when the price leaves the oversold area during an uptrend. This may be your cue to buy. In turn, if there’s an overall downtrend, confirmed by visual analysis or indicators, look for the price to exit the overbought zone to initiate a sell trade. Using this type of strategy, you can combine Williams %R with such indicators as Bollinger Bands or Envelops.
Traders can also use the %R to track momentum failures. During a strong uptrend, the price often reaches -20 or higher levels. If the indicator falls, and then can’t return above -20 before falling again, it means that the upward price momentum has declined and a bigger price decline may follow.
The same is true for a downtrend. Readings of -80 or lower are often reached. When the indicator can no longer get those low levels before moving higher it can indicate the price is going to increase.
In addition, just like other oscillators, Williams %R produces signals when it diverges with the price chart. But if the new price low is below the previous one, while the %R chart new low is higher than the previous one. Sell if the new price high is above the previous one, while on the %R chart new high is lower than the previous one.
Conclusion
Williams’ Percent Range perfectly manages to fulfill the task of highlighting the overbought and oversold areas. Like all other indicators, it requires confirmation and should be used in combination with other tools.
Other articles in this section
- Timeframes
- Renko charts Japanese candlestick chart
- Types of charts
- Heiken Ashi
- Quantitative easing policy
- Pivot Points
- ZigZag
- Moving Average
- Relative Vigor Index (RVI indicator)
- Momentum
- Force index
- Envelopes
- Bulls Power and Bears Power
- How to trade on central bank decisions?
- CCI (Commodity Channel Index)
- Parabolic SAR
- Stochastic Oscillator
- Relative Strength Index
- Oscillators
- ADX indicator
- Bollinger bands
- Trend indicators
- Introduction to technical indicators
- Support and resistance
- Trend
- Technical analysis
- Central Banks: policy and effects
- Fundamental factors
- Fundamental analysis
- Fundamental vs technical analysis
Choose your payment system


