Renko charts Japanese candlestick chart
Information is not investment advice
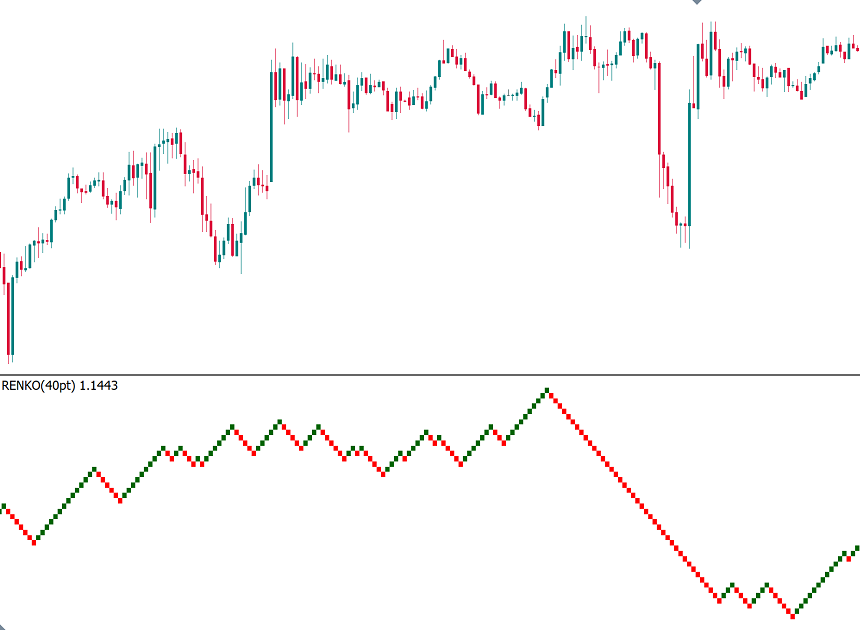
Renko chart got its name from the Japanese word “renga” which is translated as “brick”. The main difference between a Renko chart and an ordinary Japanese candlestick chart is that the Renko chart doesn’t take time into account.
A Renko brick appears when the price covers a certain distance and it doesn’t matter how much time it takes. For example, if you choose 20 pips as the brick size, a brick will only form if the price moves 20 pips up or 20 pips down. Bullish and bearish bricks have different colors. Bricks are always equal in size. They never appear next to each other. Each following brick is painted at the 45-degree angle to the previous one. The bricks do not change once they are drawn.
How to implement
Metatrader doesn’t have Renko charts in its default settings. As a result, you will need to download this tool from the Internet. It may come in the form of an indicator or an expert advisor. The indicator seems to be the most convenient option. Here’s what you should do:
- Download the indicator Download Renko Chart MT4.
- In MT4, click on “File” menu and choose “Open Data Folder”. Open the “MQL4″ folder and then click on “Indicators”. Paste the indicator into this folder.
- Restart MT4. Click “Insert”, then “Indicators”, choose “Custom” and then “LuckScout-Renko”.
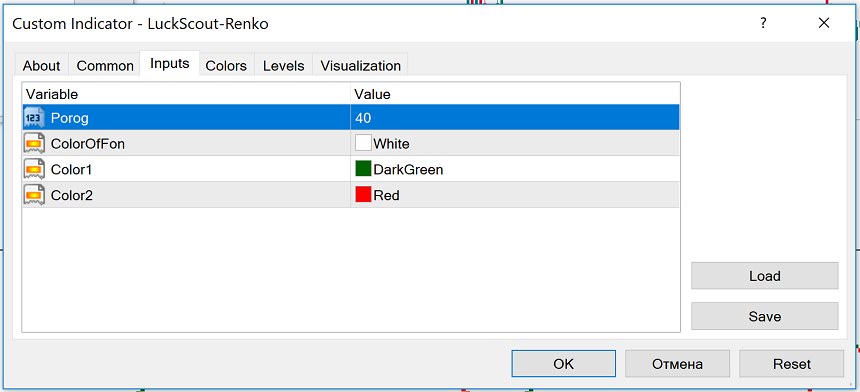
In the indicator’s settings, you choose the Renko brick size yourself depending on the asset’s volatility as well as the period of your trade. You can experiment with the brick size before you find the optimal one.
Renko chart has the following advantages:
- It’s easy to read.
- It helps to diminish market noise.
- Indicators and experts can work better with Renko.
Using Renko charts is usually recommended for short-term traders (scalpers). The signals from Renko on intraday timeframes are considered to be more efficient than those on the daily chart.
No tool is perfect, so we should also explain the disadvantages of Renko charts:
- Sometimes it takes too much time for another brick to form. This can happen when the price is consolidating. A trader may feel anxious during such times.
- If the brick size is small, you will be able to spot a reversal sooner. However, this way you will be able to filter out less noise. Choices, choices!
- During a trend, there are many bricks in one direction. As a result, your entry may not be as precise as you would like.
How to use Renko chart in your trading
The main signal produced by the Renko chart is a change in brick color: it indicates a likely change in the market. Although there are times when the Renko chart gives signals at the end of a short-lived trend, all in all, Renko allows traders to ride big trends.
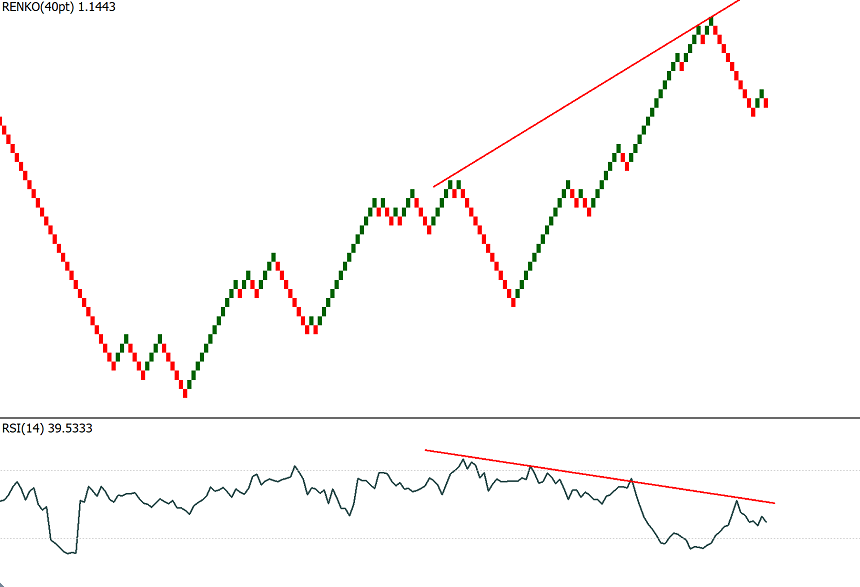
In addition, the Renko chart allows spotting even minor divergences between the price and oscillators, for example, Relative Strength Index.
Conclusion
Renko chart is just another type of charts. It has its strengths and weaknesses. If you use the Renko chart, it might be easier for you to identify trends, support and resistance levels as well as divergences with oscillators. However, you may still like candlestick chart more and that would be perfectly normal. Know that there’s a great variety of analytical instruments for Forex traders and use them to your advantage.
Other articles in this section
- Timeframes
- Heiken Ashi
- Quantitative easing policy
- Pivot Points
- ZigZag
- Moving Average
- Williams’ Percent Range (%R)
- Relative Vigor Index (RVI indicator)
- Momentum
- Force index
- Envelopes
- Bulls Power and Bears Power
- Average True Range
- How to trade on central bank decisions?
- CCI (Commodity Channel Index)
- Parabolic SAR
- Stochastic Oscillator
- Relative Strength Index
- Oscillators
- ADX indicator
- Bollinger bands
- Trend indicators
- Introduction to technical indicators
- Support and resistance
- Trend
- Technical analysis
- Central Banks: policy and effects
- Fundamental factors
- Fundamental analysis
- Fundamental vs technical analysis


