Introdução à análise das Ondas de Elliott
Informação não é consultoria em investimentos
Do que se trata a análise de Ondas de Elliott?
Você provavelmente já ouviu falar das ondas de Elliott ou até viu as mesmas, já que atualmente a análise de ondas de Elliott se tornou uma das mais populares abordagens na previsão do mercado de câmbio. Por quê? O Princípio das Ondas de Elliott é, segundo nossa experiência, a única ferramenta que pode organizar os movimentos do preço em cada intervalo de tempo, do mensal ou anual até os intervalos intradia de um minuto. Por exemplo, você pode negociar em gráficos intradia e, ao mesmo tempo, ter uma noção mais ampla. De forma simples, as ondas de Elliott são o DNA do mercado. Nos artigos a seguir, guiaremos você pelo Princípio das Ondas de Elliott. Vamos lá.
Quem é o autor?
Devemos agradecer muito a Ralph Nelson Elliott (1871 - 1948), contador e economista. Em 1938, ele publicou "O Princípio das Ondas" e seu segundo livro, "Lei da Natureza: o Segredo do Universo" foi impresso em 1946. Elliott descreveu padrões que se formam repetidamente no mercado conforme regras muito bem definidas.
Também devemos agradecer a Robert R. Prechter Jr. e a A. J. Frost pelo livro "Princípio das Ondas de Elliott: Chave para o Comportamento do Mercado", que atualmente é a fonte primária de regras e guias. Em 2006, foi publicado outro excelente livro, "O Código de Elliott", por D. V. Vozny. Infelizmente para muitos leitores mundo afora, este livro foi escrito em russo.
O começo da jornada
Esta série de artigos se baseia nos dois livros. Qualquer regra ou guia em qualquer artigo atende as regras dessas publicações. Fique tranquilo pois não irei simplesmente resenhar os livros: o que eu realmente farei é lhe ensinar o Princípio das Ondas de Elliott e compartilhar minha experiência. A maioria dos exemplos virá do mercado real e, ademais, veremos alguns casos não descritos nos livros que você pode encontrar nos gráficos.
LEGO do mercado
Há dois elementos principais no Princípio das Ondas de Elliott: impulsos (movimentos de preço de cinco ondas) e correções (movimentos de preço de três ondas). Voltaremos a este assunto nos próximos artigos, quando você verá que há um principal bloco de LEGO, que é um impulso. Por ora, no entanto, vamos nos concentrar nesses dois.
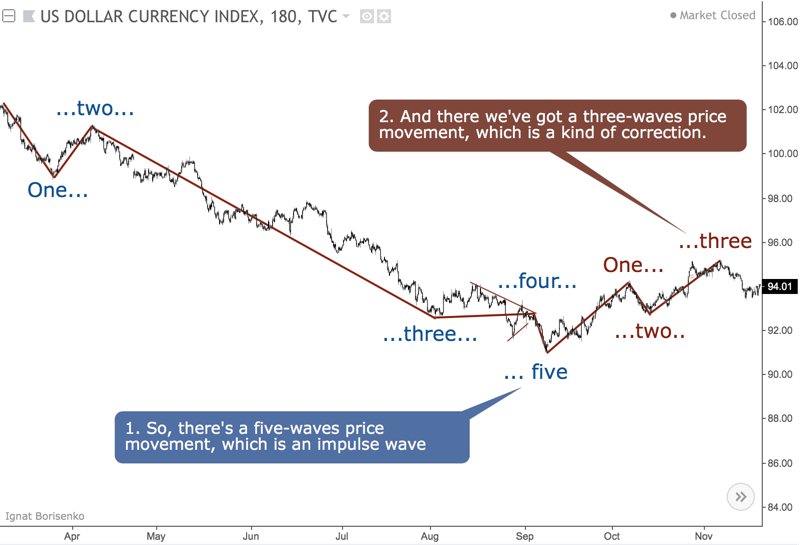
Vejamos o gráfico abaixo. Você pode ver uma queda de 5 ondas: esta é uma onda de impulso (há alguns casos nos quais poderíamos ter uma correção de 5 ondas, mas vou descrever isso depois). Também há um avanço de 3 ondas, que podemos considerar como correção. Muito bem, encontramos um impulso e uma correção: agora é hora de ter uma visão mais ampla.
O próximo gráfico é apenas a contagem real das ondas, que postei em minha análise. A queda é provável na terceira onda do impulso bearish, enquanto um salto para cima é a quarta onda na sequência.
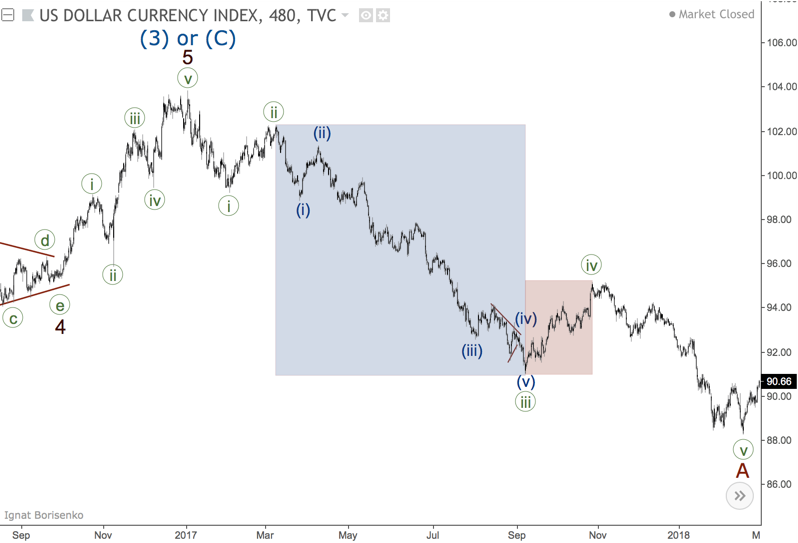
Podemos concluir o seguinte: não há onda que possa ficar separada das demais. O Princípio das Ondas de Elliott é como a famosa boneca russa Matryoshka: cada onda é formada por várias ondas menores e também é parte de uma onda maior. Esta história acontece dos intervalos de tempo maiores para os menores.
Isso diferencia o Princípio das Ondas de Elliott das outras técnicas de análise do mercado. A maioria das abordagens de análise técnica se concentram em padrões e sinais, que se destacam entre si. O poder do Princípio (POE) é a capacidade de enxergar o cenário mais amplo em vez de um mero arranjo individual.
Pensando oportunidades
Você provavelmente ouviu falar que, se usar o POE no trading, você encontrará mais do que uma contagem de ondas possível. Geralmente, você tem alguns cenários possíveis que às vezes são contraditórios. Isso é o mais empolgante no POE, pois é como jogar xadrez.
Se algum indicador "santo graal" lhe disser para comprar ou vender, você não pensará no que fazer se algo der errado. Com o POE, você está tentando deduzir as ações de trading dependendo de qual contagem de ondas está ocorrendo. Esta é uma habilidade-chave de um trader de sucesso.
Real examples
Let’s get to some real stories. The first example is the DJI index. In September 2016, the index reached the historical high, and I posted a quite bullish wave count. I expected the market much higher because the fifth wave was far from over.
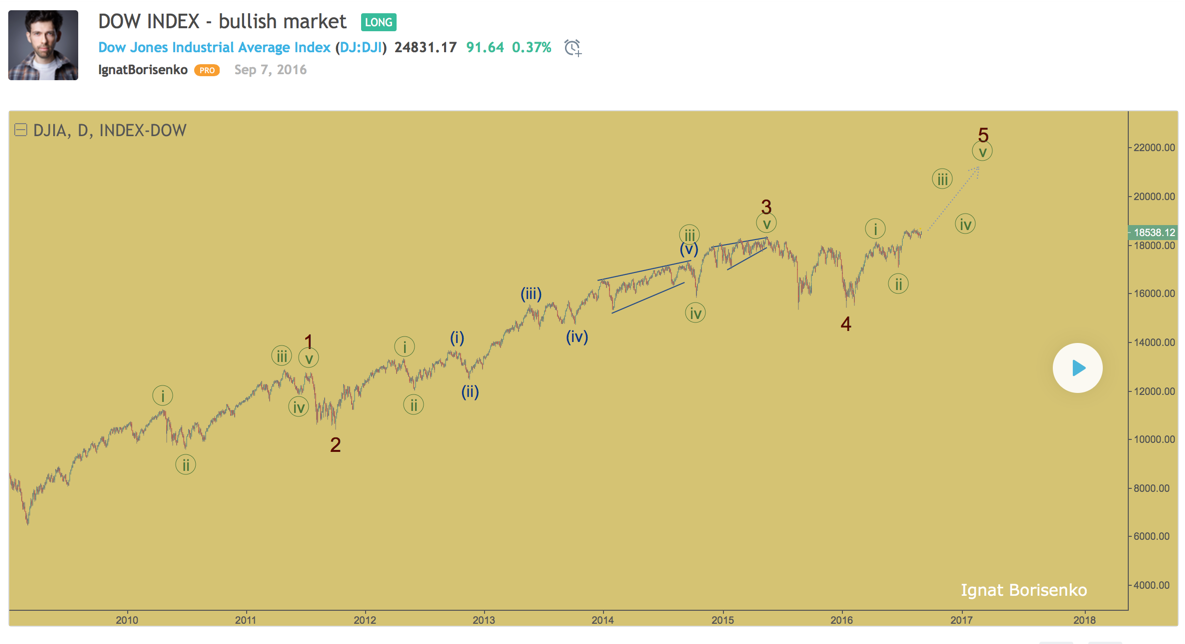
Alguns meses depois, o mercado subiu mais ainda mas eu permanecia bullish. Esta expectativa se baseava em algumas das coisas na POE que aprenderemos em breve. Por ora, você pode ver como funcionou.
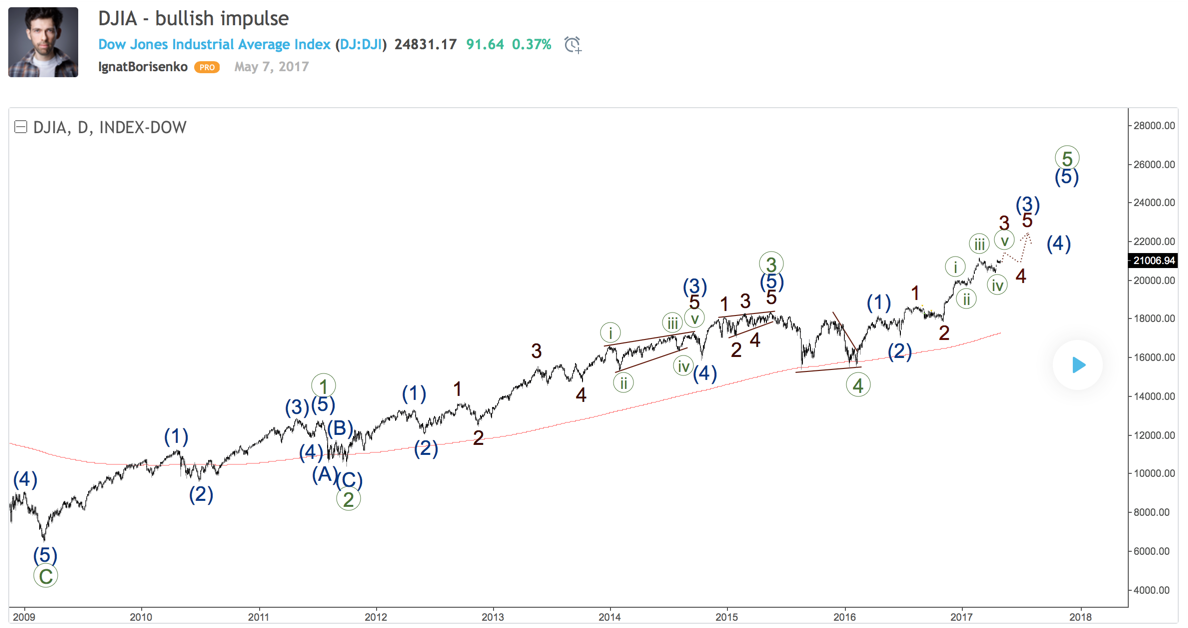
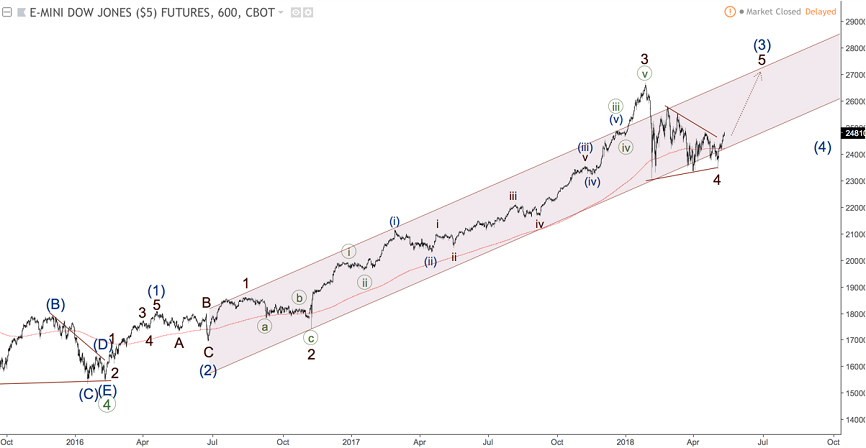
Então a tendência ainda é bullish e você pode ver a contagem de onda atual abaixo.
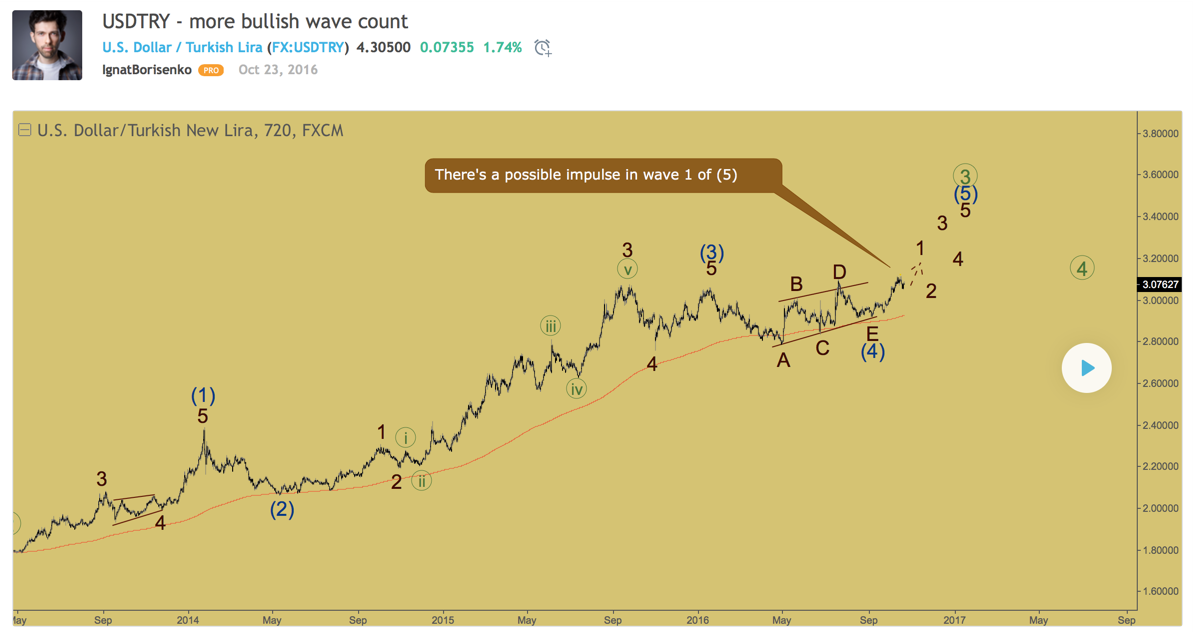
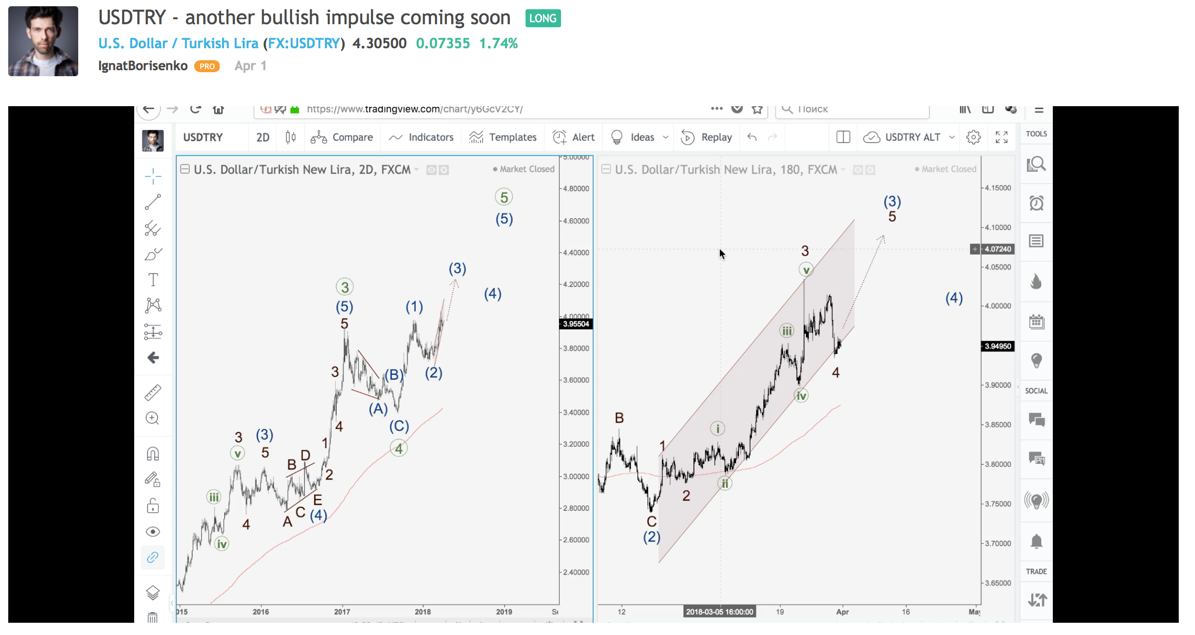
A segunda história é o USD/TRY. Em outubro de 2016, a quarta onda parecia finalizada como triângulo, então eu esperava outro impulso bullish, que veio a se desenvolver nos próximos meses.
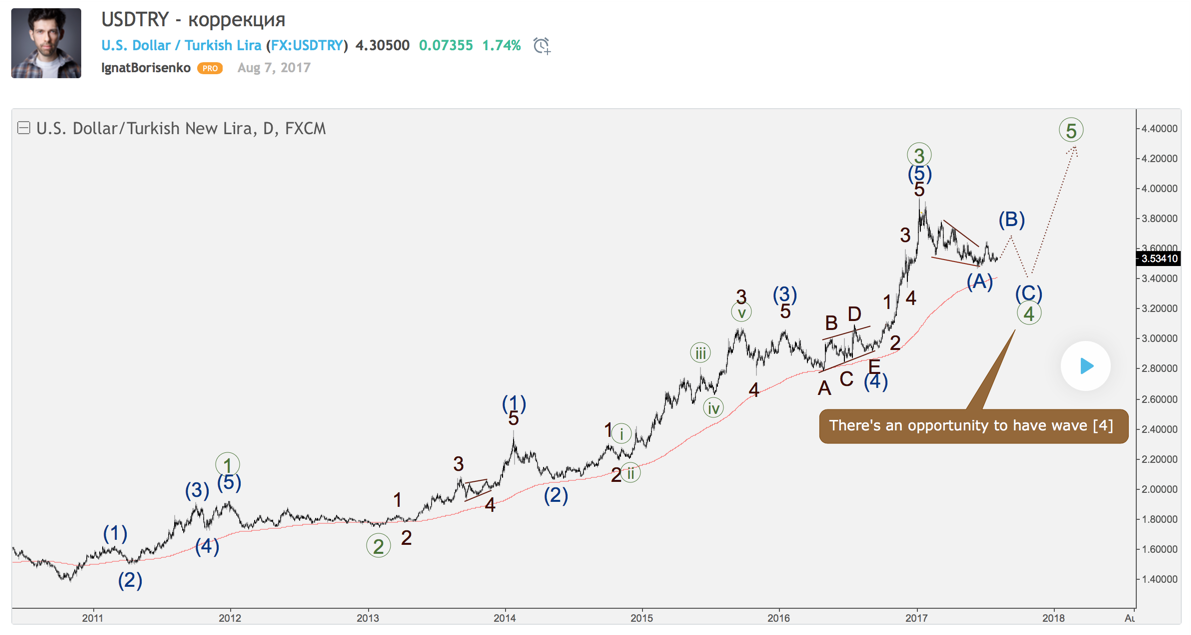
E então houve uma longa história com uma correção bearish que finalmente acabou, momento no qual a tendência bullish deve continuar como esperado.
Finalmente, em abril de 2018, houve outro momento bullish em razão do possível fim da onda 4. Logo, o mercado subiu mais ainda.
Moral da história
Também há exemplos ruins. No entanto, falando de trading, o mais importante é aquilo que você faz quando o mercado está se movendo ao longo da tendência conforme sua contagem de ondas. Logo, podemos usar o POE como ótima ferramenta para encontrar oportunidades nos mercados.
Ademais, você não é obrigado a negociar em qualquer contagem de onda que você marcou ou viu na web. Você deve negociar somente as melhores contagens quando tiver um ótimo momento para abrir uma negociação. Em outras palavras, você deve esperar uma boa chance, assim como um caçador na floresta. Quando você vir a oportunidade, faça o seu melhor para negociar nela com o máximo de sucesso.
Isso é só o começo. Nos próximos artigos, nós vamos percorrer as regras e guias mais específicos do POE.
Outros artigos nesta seção
- Estrutura de um robô de negociação
- Construir um robô de negociação sem programar
- Como lançar robôs de trade no MetaTrader 5?
- Trading algorítmico. O que é isto?
- Trading algorítmico com MQL5
- O que significa “truncamento“?
- Ichimoku
- Padrão diagonal principal
- Padrão de ondas de Wolfe
- Padrão dos Três Avanços (Three Drives)
- Tubarão
- Borboleta
- Caranguejo
- Bat
- Gartley
- ABCD
- Padrões harmônicos
- Como negociar rompimentos
- Negociando com notícias Forex
- Como colocar uma ordem Take Profit?
- Gestão de riscos
- Como colocar uma ordem Stop Loss?
- Indicadores técnicos: negociação de divergências


