


Momentum
Information is not investment advice
In technical analysis, there’s such term as “momentum” that refers to the strength behind the trend. Momentum is gauged by a number of technical indicators (RSI, Stochastic Oscillator, MACD). Each indicator uses a slightly different approach and has its own formula. Here we will present another indicator from this group. It’s name is simply “Momentum”.
The Momentum technical indicator measures the amount that an asset’s price has changed over a given period of time. The indicator’s formula compares the most recent closing price to a previous closing price.
How to implement Momentum
To add the Momentum to a chart, click “Insert” – “Indicators” – “Oscillators” – and you will see the “Momentum”.
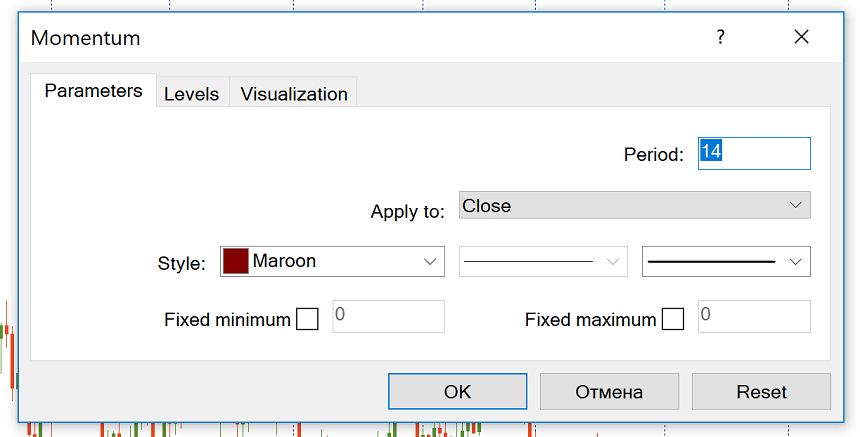
The default parameter for Momentum in MT4 is 14, but you can set it to whatever value you wish. The indicator can be successfully used on any timeframe. Notice that the smaller the timeframe used, the more sensitive the performance will be. At the same time, the indicator is likely to generate more false signals compared with its work on a bigger timeframe.
How to interpret Momentum technical indicator
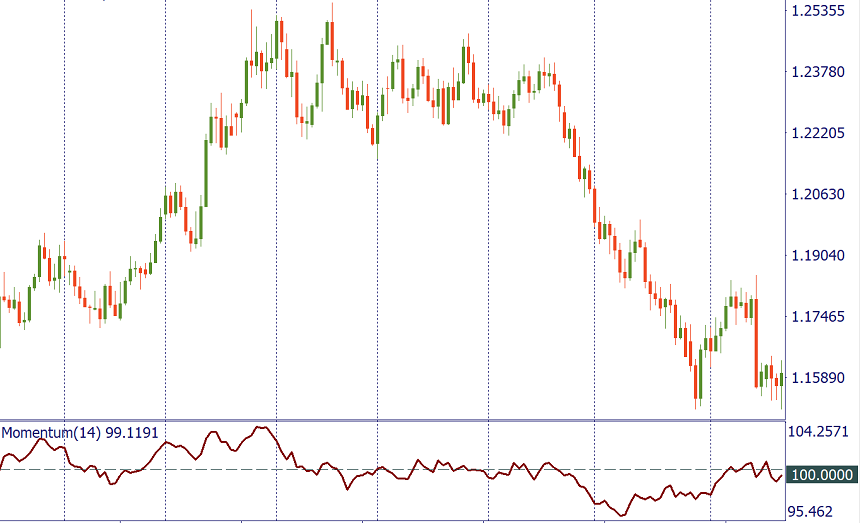
The Momentum oscillates around a center value of 100. This level is not automatically marked in MetaTrader, but you can draw it. When the indicator’s value rises above 100, it signals that buyers are in charge. On the contrary, a move below 100 is a sign of bears’ domination.
If Momentum reaches extremely high or low values (relative to its historical values), the odds are that the current uptrend/down will continue. Extreme levels of the indicator mean that there’s enough momentum behind a trend to keep the price going.
At the same time, the Momentum indicator can also help to identify when a market is overbought or oversold. When a falling market is oversold, it may be about to bounce. If the Momentum bottoms and turns up, it’s a buy signal. When a rising market is overbought, it may be about to fall. If the Momentum peaks and turns down, it’s a sell signal.
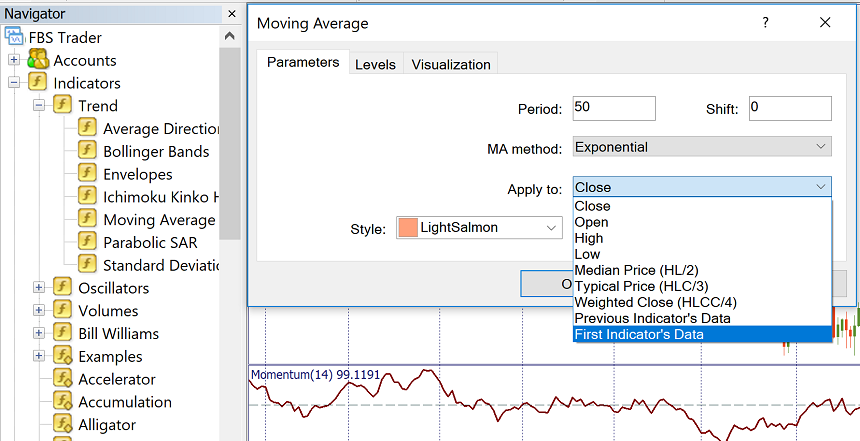
You can apply a short-term moving average to the indicator so that it would be easier to determine its turning points. To do this, choose “Moving Average” among MT4’s trend indicators in the “Navigator” panel, and then drag and drop it into the Momentum indicator chart. In the window that pops up, choose “First Indicator’s Data” from the “Apply to” dropdown menu of the “Parameters” tab.
The strategy will then be to buy when the Momentum crosses the MA to the upside, and sell when it crosses the SMA to the downside. This way the timing of the signals will somewhat improve.
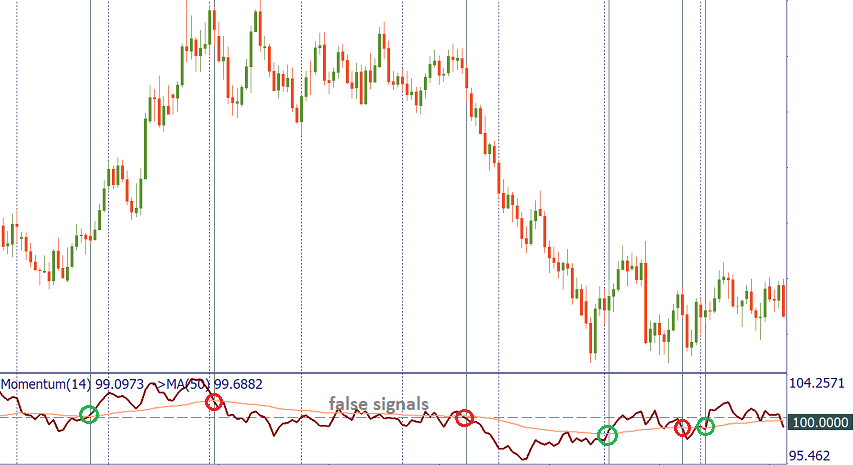
It’s wise to pick the signals which are in line with the trend you observe on a bigger timeframe or using other trend indicators.
Enter the market only after prices confirm the signal generated by the indicator. If the Momentum has topped, wait for the price to start falling and then sell.
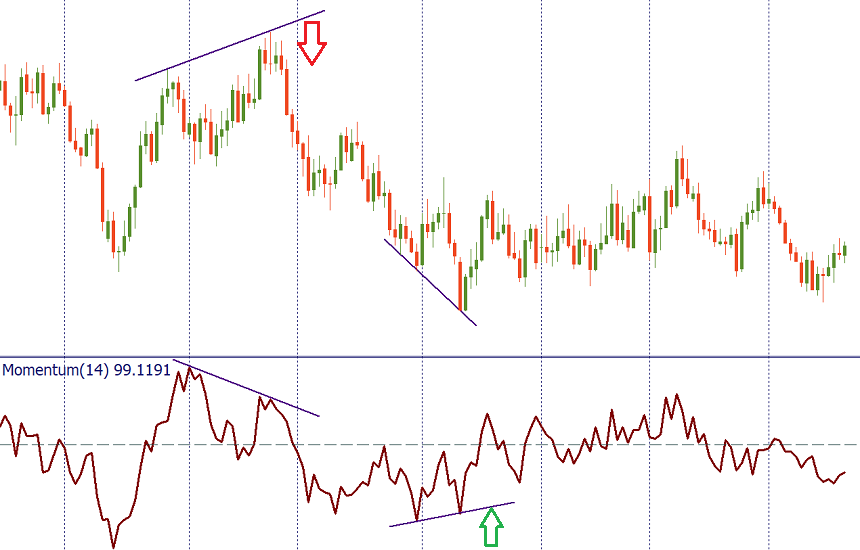
Often the Momentum begins to turn before the price does. When the Momentum is diverging from the price, it may be regarded as a leading indicator pointing at the potential top (when the Momentum is falling while the prices are going up) or bottom (when the Momentum is increasing while the prices are going down).
Conclusion
The Momentum oscillator helps traders to notice subtle shifts in the force of buying or selling. It’s possible to use it for generating trade signals, although in this case we strongly recommend making sure that you combine the indicator with price action signals. Notice that the Momentum indicator can offer even bigger benefits if it’s used for confirmation of signals provided by other tools.
Other articles in this section
- Timeframes
- Renko charts Japanese candlestick chart
- Types of charts
- Heiken Ashi
- Quantitative easing policy
- Pivot Points
- ZigZag
- Moving Average
- Williams’ Percent Range (%R)
- Relative Vigor Index (RVI indicator)
- Force index
- Envelopes
- Bulls Power and Bears Power
- Average True Range
- How to trade on central bank decisions?
- CCI (Commodity Channel Index)
- Parabolic SAR
- Stochastic Oscillator
- Relative Strength Index
- Oscillators
- ADX indicator
- Bollinger bands
- Trend indicators
- Introduction to technical indicators
- Support and resistance
- Trend
- Technical analysis
- Central Banks: policy and effects
- Fundamental factors
- Fundamental analysis
- Fundamental vs technical analysis
Choose your payment system


