


ADX indicator
Information is not investment advice
The Average Directional Index, or ADX, is the trend strength indicator. Trend traders want to find a strong trend and open positions in its directions. The ADX helps to judge how strong a trend is.
The indicator is based on a moving average of price range expansion over a given period of time.
How to implement the Average Directional Index
You can add the ADX to a chart by clicking “Insert” – “Indicators” – “Trend” and then choosing “Average Directional Movement Index”.
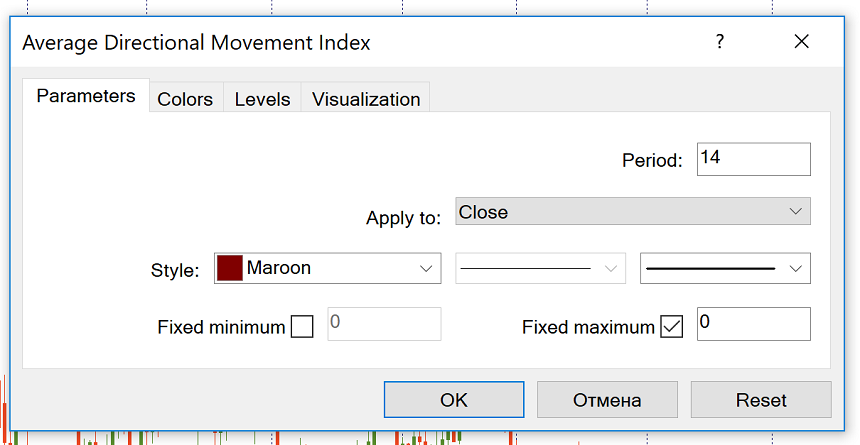
By default, the number of periods is set at ‘14’. You can change this number if you want to.
How to trade using ADX indicator
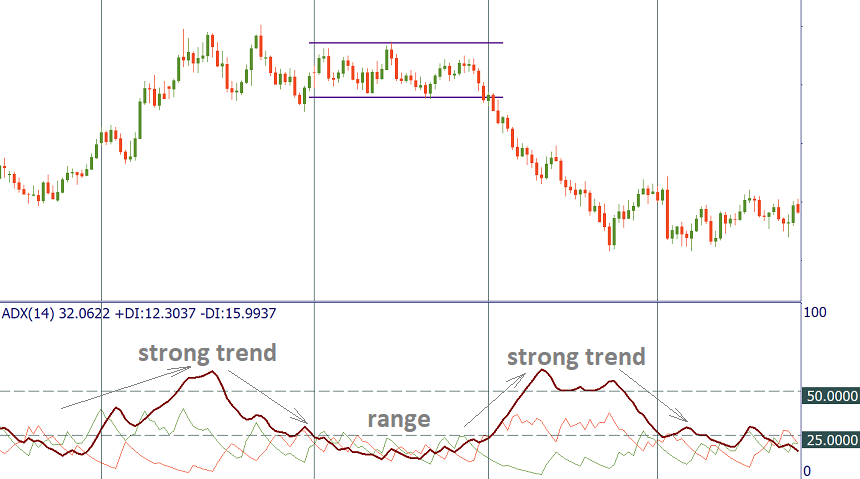
The MT4 indicator automatically includes 3 lines:
- Average Directional Index (ADX) itself (thick brown line). Its values range from 0 to 100. This line registers a trend’s strength but it doesn’t show its direction.
- Plus Directional Movement Indicator (+DMI) (green line) is the difference between two consecutive highs.
- Minus Directional Movement Indicator (-DMI) (red line) is the difference between two consecutive lows.
The ADX line is used to determine if an asset is trending or not. A strong trend is in place when ADX is above 25, so there’s a sense to use trend-trading strategies. Consequently, when the ADX is below 25, it’s better to avoid trend trading and choose an appropriate range trading strategy. In such moments, the price enters a range. It’s necessary to point out that the ADX may be used to confirm a breakout of a range. When the ADX rises from below 25 to above 25, it means that the price is strong enough to continue in the direction of the breakout.
ADX value
There are more grades of the ADX value. You can check them in the table below:
| ADX Value | Trend Strength |
| 0-25 | Absent or Weak Trend |
| 25-50 | Strong Trend |
| 50-75 | Very Strong Trend |
| 75-100 | Extremely Strong Trend |
All in all, when the ADX line is going up, trend strength is increasing, and the price moves in the direction of the trend. When the line is going down, trend strength is decreasing, and the price goes through a correction or consolidation. Notice that the falling ADX line doesn’t mean that a trend is reversing. It simply means that the current trend is weakening.
In addition, if you look at the series of ADX peaks, you will get information about the trend’s momentum. If there’s a series of higher ADX peaks, trend momentum is increasing. This will let a trader know that he/she may keep the trend trades open letting the profit run. A series of lower ADX peaks means trend momentum is decreasing. Be aware that despite the decreasing momentum the trend may still continue. Still, in this case, a trader would have to be more attentive and selective about the new entry signals. It might be wise to tighten stops for the existing positions or think about partial take profits.
Classic signals from the ADX
+DMI and -DMI define the directional movement. In general, the bulls prevail when +DMI is greater than - DMI, while the bears have the edge when -DMI is greater. Crosses of +DMI and -DMI make a trading system in combination with ADX.
“Buy” signal occurs when +DMI crosses above -DMI (ADX must be above 25). Stop-loss is usually put at the low of the signal day. The buy signal remains in force as long as this low holds, even if +DMI crosses back below - DMI.
And vice versa, “sell” signal occurs when -DMI crosses above +DMI (ADX must be above 25). The high of the signal day becomes the initial stop-loss.
Conclusion
The Average Directional Index is a very useful tool for trend traders. It’s recommended to use the ADX in combination with the analysis of price action and other technical indicators.

Other articles in this section
- Timeframes
- Renko charts Japanese candlestick chart
- Types of charts
- Heiken Ashi
- Quantitative easing policy
- Pivot Points
- ZigZag
- Moving Average
- Williams’ Percent Range (%R)
- Momentum
- Force index
- Envelopes
- Bulls Power and Bears Power
- Average True Range
- How to trade on central bank decisions?
- CCI (Commodity Channel Index)
- Parabolic SAR
- Stochastic Oscillator
- Relative Strength Index
- Oscillators
- Bollinger bands
- Trend indicators
- Introduction to technical indicators
- Support and resistance
- Trend
- Technical analysis
- Central Banks: policy and effects
- Fundamental factors
- Fundamental analysis
- Fundamental vs technical analysis
Choose your payment system


