


Stochastic Oscillator
Information is not investment advice
The Stochastic indicator developed by George C. Lane at the end of the 1950s and is actively used among traders all over the world ever since. It evaluates the market’s momentum and compares the closing price to a price over a certain period of time. The idea behind the indicator is that in bullish market prices will close near the high, and in a bearish market prices close near the low.
The Stochastics can show when the asset you trade is overbought or oversold. It signals when the market’s momentum is slowing down. This, in turn, means that a change in trend is likely. As a result, the observation of the indicator may provide you with trade signals and ideas.
How to implement indicator
The Stochastics is included in the default set of MetaTrader. You can add it to the chart by clicking “Insert” – “Indicators” – “Oscillators” and then choosing “Stochastic Oscillator”.
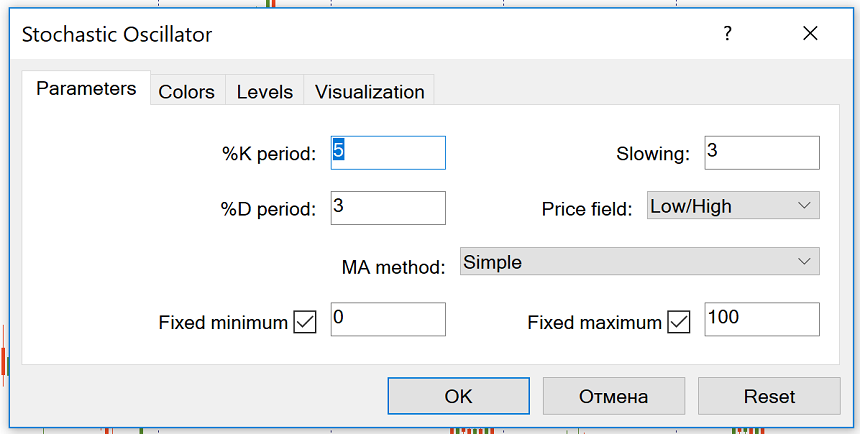
The Stochastic Oscillator can be used on all timeframes. The default settings are 5, 3, 3. Other commonly used settings for Stochastics include 14, 3, 3 and 21, 5, 5. Stochastics is often referred to as Fast Stochastics with a setting of 5, 4, Slow Stochastics with a setting of 14, 3 and Full Stochastics with the settings of 14, 3, 3.
Fast Stochastics responds more quickly to the changes in the market price, while Slow Stochastics reduces the number of false crossovers and thus filters out some of the false signals. It’s up to you to choose the parameters you want.
How to trade using Stochastic
The Stochastic is measured in % from 0 to 100. The indicator is represented by 2 lines: the fast one, also called %K (solid green line) and the slow one, which is referred to as %D (red dashed line). Line %D is the moving average of %K.
These lines intersect when momentum changes. The signal is to buy when % K (green) crosses % D (red) from the bottom up. Sell when % K crosses % D top down.
Like any other indicator, the Stochastics doesn’t give the signals that are 100% profitable. There are 2 ways to make the signals of this indicator more precise:
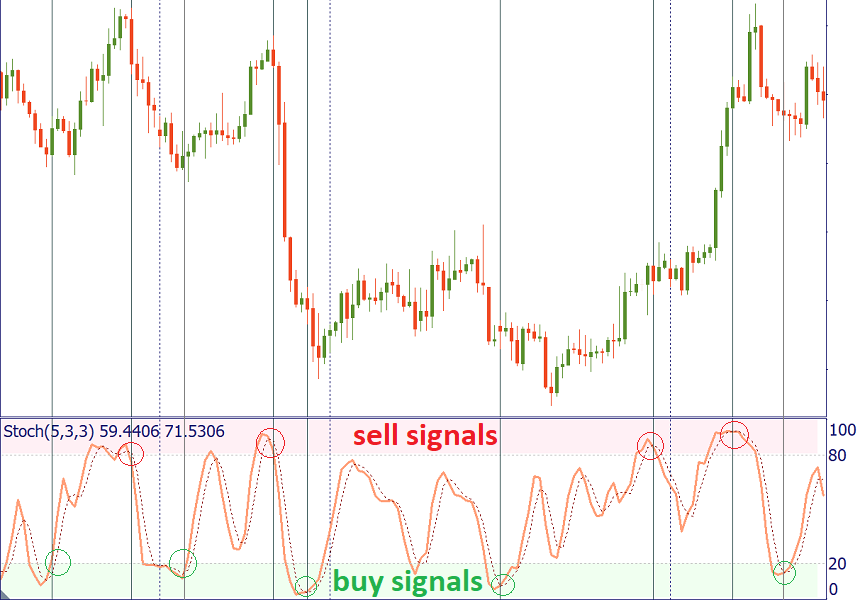
1. Use the signals generated when the crossover happens in the extreme area (above 80 for sell signal and below 20 for buy signal).
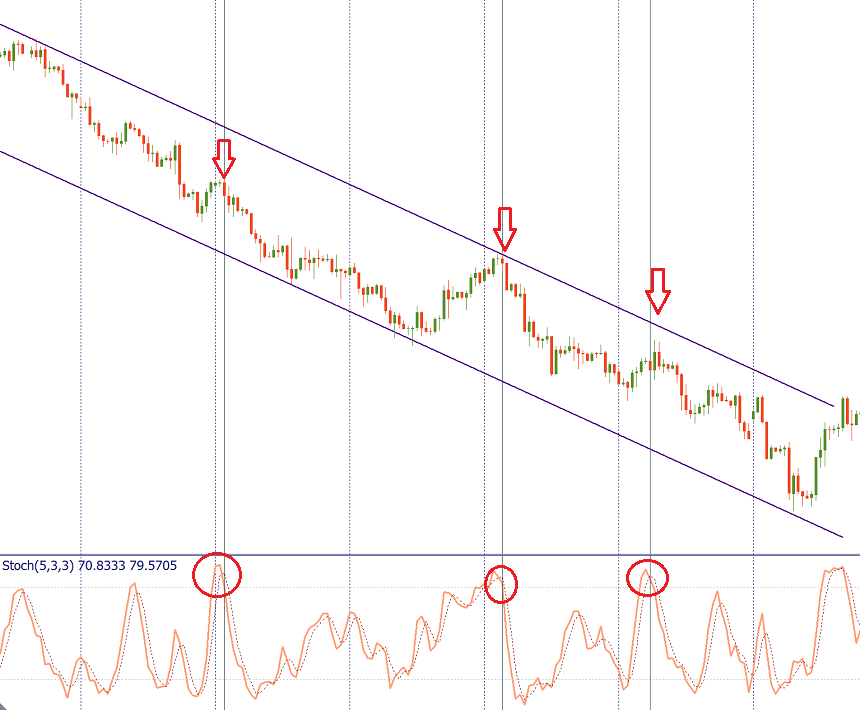
2. Take into account the trend on a larger timeframe and trade in line with it. For example, if you use Stochastic on H1, check the trend on H4. If there’s a strong uptrend, don’t take the sell signals as the price may stay in the overbought area for extended periods of time. Instead, focus on the buy signals generated by Stochastics and you will have the benefits of trend trading.
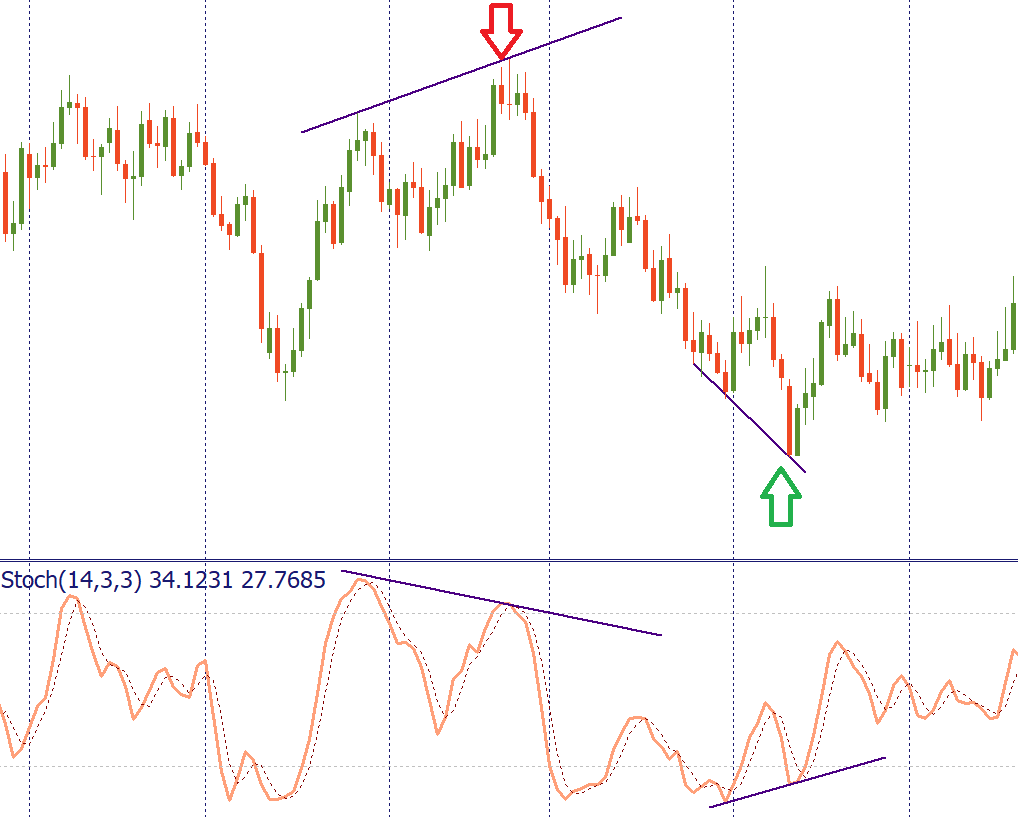
In additions, as with other oscillators, pay attention to the situations when the Stochastic Oscillator is in divergence with the price chart. A sell signal occurs when the price makes a higher high but the Stochastic forms a lower high (bearish divergence). A buy signal appears when the new low of the price is not confirmed by the oscillator.
It’s also recommended to use the Stochastic Oscillator in combination with other tools of technical analysis, such as Moving Averages, Heiken Ashi, Alligator, etc.
Conclusion
The Stochastic Oscillator is a powerful tool of technical analysis. It has several purposes and can be the basis of a good trading system.

Other articles in this section
- Timeframes
- Renko charts Japanese candlestick chart
- Types of charts
- Heiken Ashi
- Quantitative easing policy
- Pivot Points
- ZigZag
- Moving Average
- Williams’ Percent Range (%R)
- Relative Vigor Index (RVI indicator)
- Momentum
- Force index
- Envelopes
- Bulls Power and Bears Power
- Average True Range
- How to trade on central bank decisions?
- CCI (Commodity Channel Index)
- Parabolic SAR
- Relative Strength Index
- Oscillators
- ADX indicator
- Bollinger bands
- Trend indicators
- Introduction to technical indicators
- Support and resistance
- Trend
- Technical analysis
- Central Banks: policy and effects
- Fundamental factors
- Fundamental analysis
- Fundamental vs technical analysis
Choose your payment system


