


Williams’ Strategy
Bill Williams is the creator of some of the most popular market indicators: Awesome Oscillator, Fractals, Alligator, and Gator.

Don’t waste your time – keep track of how NFP affects the US dollar!
Data Collection Notice
We maintain a record of your data to run this website. By clicking the button, you agree to our Privacy Policy.

Beginner Forex Book
Your ultimate guide through the world of trading.

Check Your Inbox!
In our email, you will find the Forex 101 book. Just tap the button to get it!
Risk warning: ᏟᖴᎠs are complex instruments and come with a high risk of losing money rapidly due to leverage.
66.43% of retail investor accounts lose money when trading ᏟᖴᎠs with this provider.
You should consider whether you understand how ᏟᖴᎠs work and whether you can afford to take the high risk of losing your money.
Warning! Old version of the browser!
Press one of the icons below to proceed to the official website of the developer and download the latest version of your browser.

Online Forex broker
2022-08-26 • Updated
Information is not investment advice
Introduction
In technical analysis, there are different chart patterns which help you to determine the further direction for the price. In the broadest sense, all of these patterns are divided into the two large groups: reversal and continuation chart patterns. You can learn how to define them in our Forex Guidebook. Today, we will present you the trading strategy for one of the most commonly known patterns. Of course, we are talking about the Head and shoulders pattern.
What is the Head and shoulders pattern?
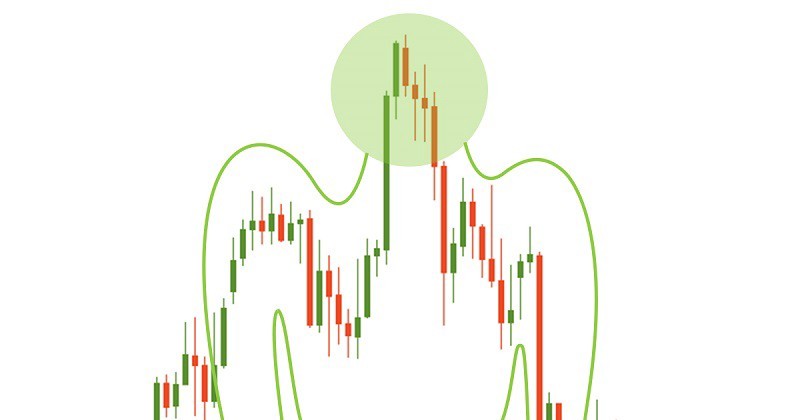
What comes to your mind when you hear the words “head and shoulders”? If it is the smell of your favorite shampoo, then you don’t trade hard enough! The first thing which comes to the mind of a professional trader is, of course, the famous reversal pattern.
The head and shoulders pattern usually occurs at the end of the uptrend. You can easily spot it on any timeframe. It is formed by a peak (first shoulder), higher peak (head), and a lower peak (second shoulder). You can draw a “neckline” by connecting the minimums of the left shoulder and the head. The neckline shouldn’t be horizontal. Its slope may either be up or down. When the slope is down, the pattern provides a more reliable sell signal.
If you trade during the downtrend, you need to look for the inverse Head and shoulders pattern on the chart. This pattern is exactly opposite to the classic Head and shoulders pattern and may signal a bullish reversal.
How the pattern is formed?
- When bulls get tired to ride a trend as a price becomes unbearably high for the current market conditions, bears come into play and try to pull the price down. If the price tests the downside and then bounces back, it creates the left shoulder of the pattern.
- After that, bulls make their final attempt to push the price higher. That’s how the “head” of the pattern is formed.
- However, bulls cannot hold a price at such a high level and bears make the price to fall back to create the continuation of the neckline.
- “Alright, now these horned animals gave up completely”, - you thought. And you were wrong! Buyers try again with their weaker forces to push the price to a new high. But this high comes out lower than the “head”. This is the right shoulder of the pattern.
- Then bears take over and pull the price lower. Their pressure is too strong and they manage to break the neckline.
- Sometimes, the price may go up again with a lower volume and retest the neckline. This small rise offers an opportunity to open a short position with the stop loss placed above the neckline. But this situation does not occur every time the Head and shoulders is formed.
- Bears push the price further down.
How to trade this pattern
There are several strategies to trade the Heads and Shoulders pattern. We will introduce you the easiest ones. The strategies listed below are universal: they may be applied to any currency pair, stock or commodity on any timeframe and they do not require additional indicators.
Let’s look at the 4-hour chart for USD/JPY. We can see, that the Head and shoulders pattern was implemented.
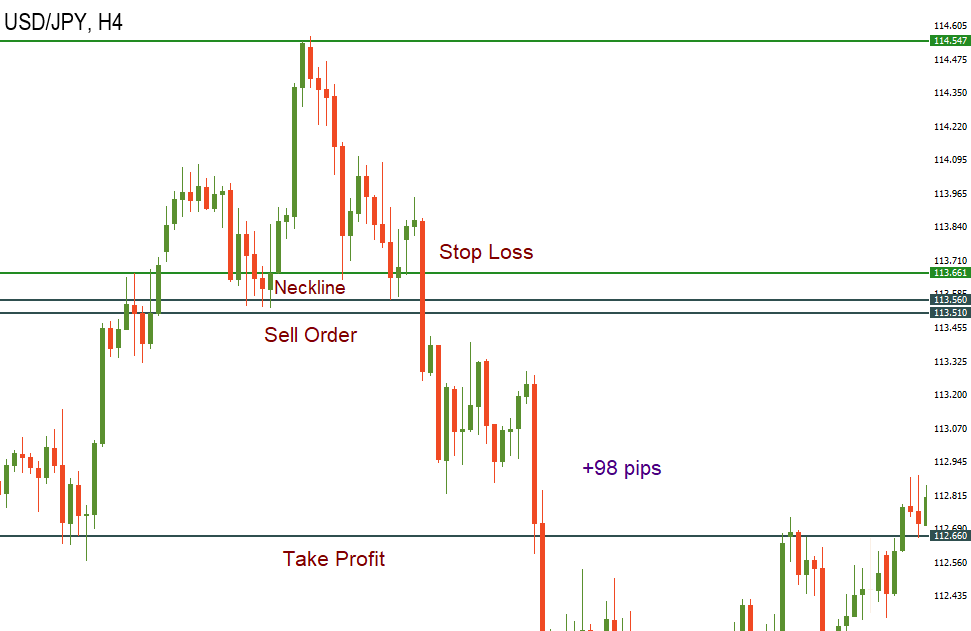
Bulls could not hold the price at the highs at 114.54 and the pair fell below the neckline at 113.56. We opened a sell order after the break of the neckline, 5 pips below it at 113.51. We set our stop loss 5 pips above the neckline at 113.66. Then we counted the level of our take profit using the following formula:
114.54 (the top of the “head”) – 113.56 (the neckline) = 0.98
113.640-0.98=112.66
Success! You’ve earned around 100 pips!
You can use this strategy for the inverse Head and Shoulders, too. Here are the steps:
On the H4 chart of USD/CAD, we can see the Head and shoulders pattern. We see, that the neckline is not so perfect, but its slope goes up, which means the reversal is likely to happen.
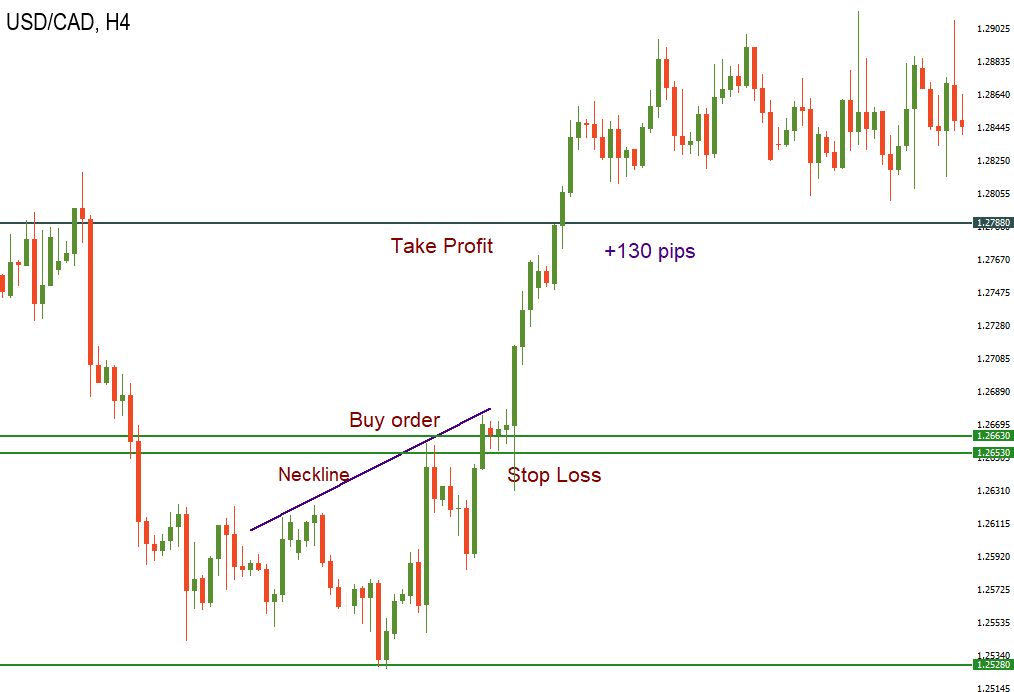
We place a stop loss at 1.2653 and wait for the breakout of the neckline. When the candlestick is formed, we open a long order at 1.2663. We count our take profit:
1.2658 (the neckline) - 1.2528 (the head) = 0.0130
1.2658+0.013=1.2788.
Using this strategy, you earned 130 pips.
Conclusion
The Head and shoulders pattern is noticeable on the chart and provides a good opportunity for profitable trading with limited risks.

Bill Williams is the creator of some of the most popular market indicators: Awesome Oscillator, Fractals, Alligator, and Gator.

Trend strategies are good - they may give significantly good results in any time frame and with any assets. The main idea of the ADX Trend-Based strategy is to try to catch the beginning of the trend.

Counter-trend strategies are always the most dangerous but also the most profitable. We are pleased to present an excellent counter-trend strategy for working in any market and with any assets.


Your request is accepted.
We will call you at the time interval that you chose
Next callback request for this phone number will be available in 00:30:00
If you have an urgent issue please contact us via
Live chat
Internal error. Please try again later