


MACD (Moving Average Convergence/Divergence)
Information is not investment advice
The MACD is one of the most potent technical tools in the arsenal of many traders. The indicator is used to check the strength and the direction of a trend as well as to define reversal points.
The MACD stands for the Moving Average Convergence Divergence and shows the relationship of the price’s two Moving Averages.
How to implement MACD
MACD is included in MetaTrader default indicator kit, so you don’t need to download it. Go to “Insert”, find “Indicators” and then “Oscillators” – and you will see the MACD. The indicator will appear in a separate window below the price chart.
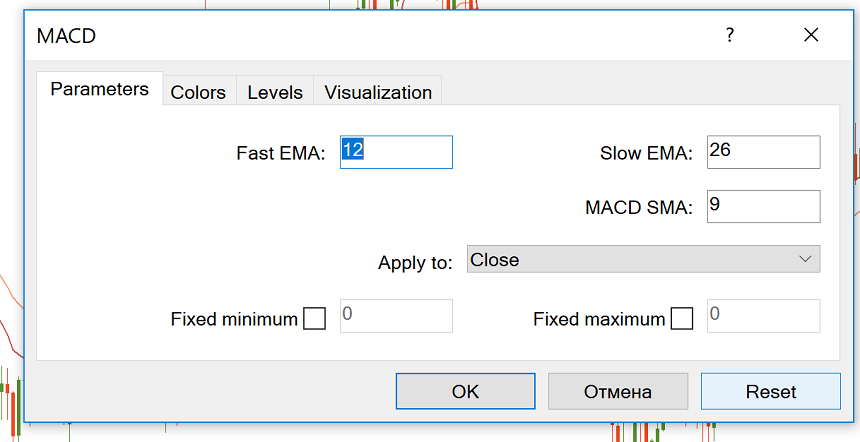
The classic settings include 12 and 26 EMAs and a signal line (SMA) with a period of 9. You can choose other parameters depending on your trading style and goals. For example, the MACD (5,35,5) is more sensitive and might be better suited for weekly charts.
Increasing the number of periods for the signal line will reduce the number of crossover signals, helping avoid false signals. However, trade signals will occur later than they would with a shorter signal line EMA.
The indicator can be applied to any timeframe, but it’s preferable to choose those from H1 and bigger.
How the MACD indicator works
The main idea behind the MACD is that it subtracts the longer-term moving average from the shorter-term moving average. This way it turns a trend-following indicator into the momentum one and combines the features of both.
The MACD has no bounds, but it has a zero mean, around which it tends to oscillate as the moving averages converge, intersect and diverge.
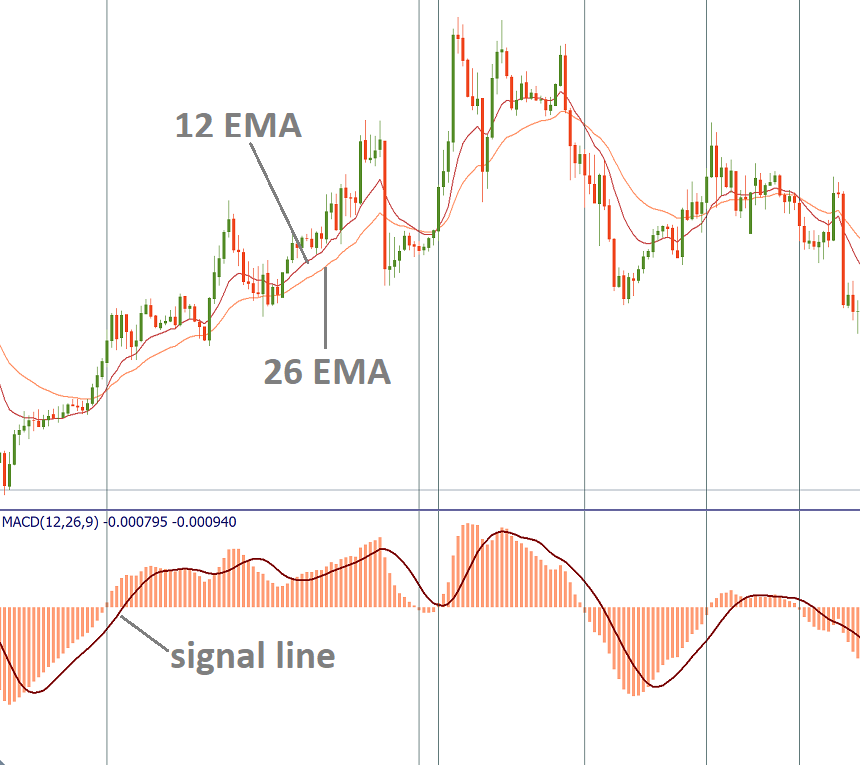
Convergence occurs when the moving averages move towards each other. Divergence takes place when the moving averages move away from each other. The MACD histogram is above 0 when the 12-period MA is above the 26-period MA and below 0 when the shorter MA is below the longer MA. As a result, positive values of the histogram point at a bullish trend, while negative values mean a downtrend.
How to use MACD in Forex trading
All in all, the market is bullish when the MACD is above 0 and bearish when it’s below 0.
The MACD provides traders with several types of signals: signal line crossovers, overbought/oversold levels, centerline crossovers, as well as divergences.
1. Signal line crossovers
A bullish crossover happens when the MACD starts rising and then goes above the signal line. A bearish crossover happens when the MACD starts declining and crosses the signal line to the downside.
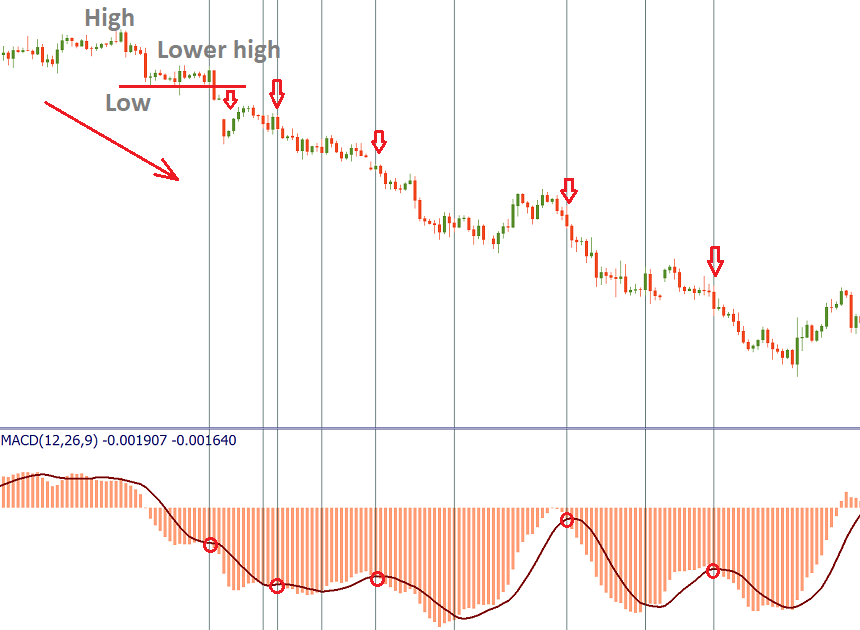
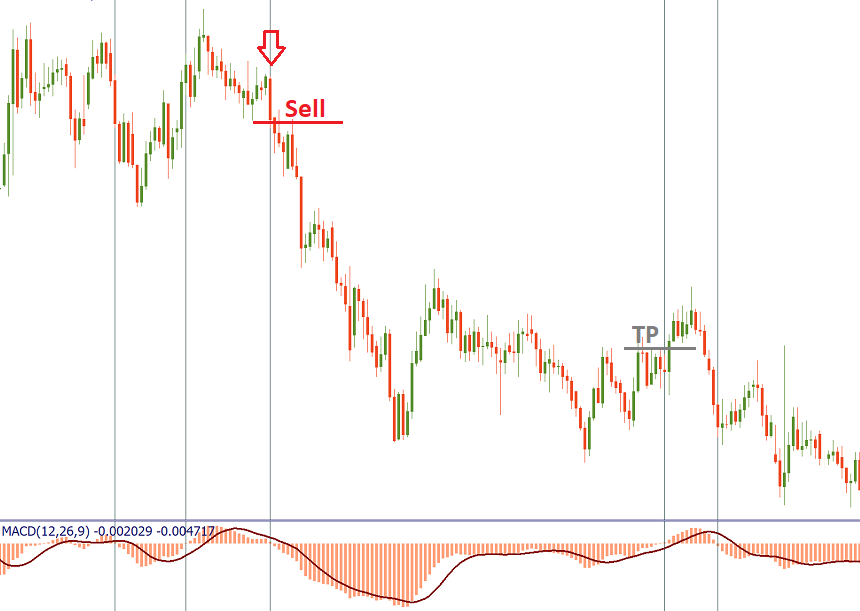
The MACD works best in trends when the price range in rather narrow. A good strategy may be to establish a trend and then to use only those MACD signals which are in line with this trend.
On the picture below, you can see that in a downtrend it’s wise to trade only negative MACD crossovers with the signal line.
2. Overbought/oversold levels
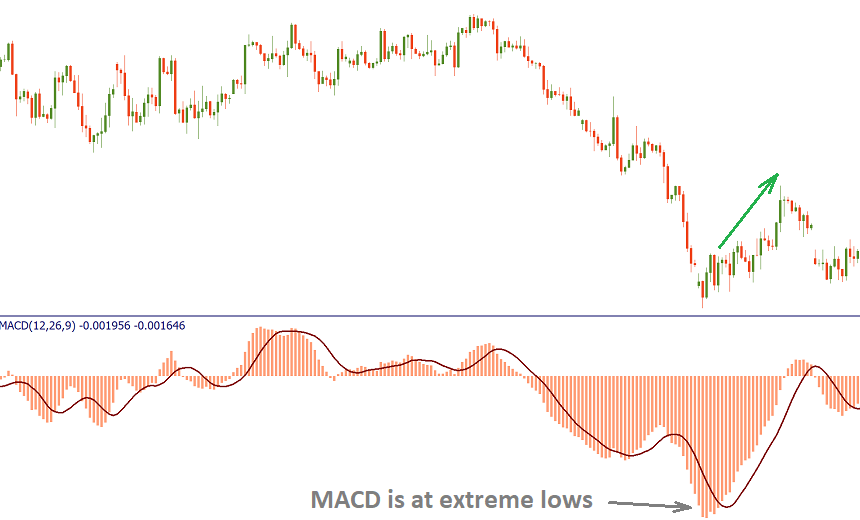
It’s also possible to use the MACD as an oscillator. It’s common knowledge that the market always returns to the mean and the fast MA always returns to the slow one. The bigger the divergence between the Moving Averages (the higher of the lower is the MACD histogram), the more bullish/bearish the market is and the higher the probability of the price correction that will lead the MACD back to 0.
As a result, it’s possible to trade extreme highs/lows of the MACD as a sign that the market is overbought/oversold. As the indicator has no upper or lower limits, you should judge extremes by the visual comparison of the MACD levels. Notice that this kind of signals requires confirmation from price action or other technical indicators.
3. Zero line crossovers
A bullish zero line crossover occurs when the MACD moves above 0 to turn positive. It can be used as a confirmation of an uptrend. A bearish zero line crossover takes place when the MACD gets below 0 to turn negative. This can be used to confirm a downtrend.
Here the MACD gives trading signals similar to a two moving average system. One of the strategies is to buy when the MACD rises above the zero line (holding the position until the price returns below 0) and sell when the MACD crosses below the zero line (and closing the trade when the price gets back above 0). However, this approach is profitable only when strong trends emerge. During the volatile sideways market, this may result in losing trades.
4. Divergences
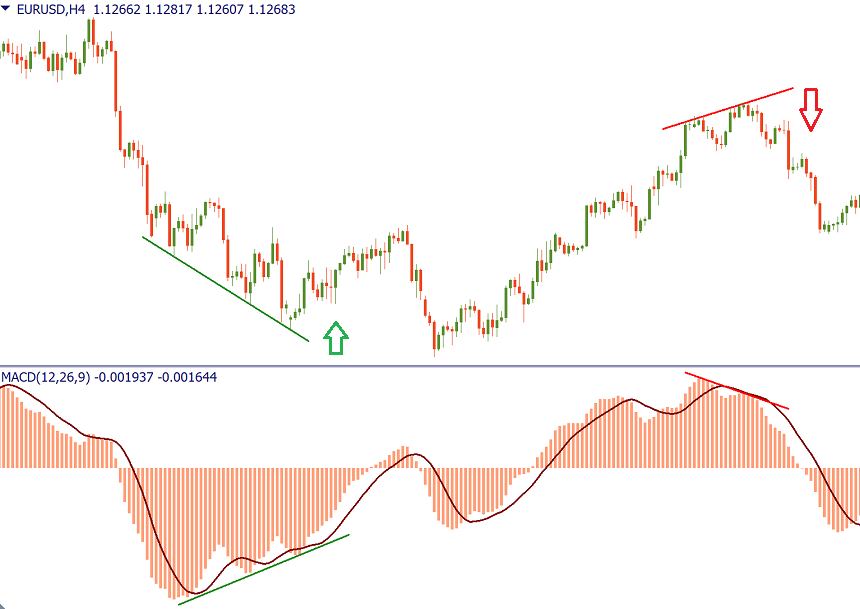
In addition, pay attention to divergence/convergence between the indicator and the price. Bullish convergence is formed, when the price sets lower lows, while the minimums of the MACD histogram get higher (buy signal). Bearish divergence is formed, when the price renews highs, while the MACD maximums become lower (sell signal).
Advantages and disadvantages
One of the biggest advantages of the MACD is that it’s both a trend and momentum indicator. However, like all other technical indicators, the MACD isn’t perfect. Its main flaw is that it gives the signals later than the price action itself. In addition, the MACD doesn’t provide ready-to-use stop loss or take profit levels.
Conclusion
The MACD is a very useful technical indicator. It produces a variety of signals and can represent a solid foundation of a trading system. To filter out false signals, use the MACD in combination with other tools of technical analysis. For example Envelopes and ADX indicator
Other articles in this section
- How to start trading on Forex?
- How to open a trade in MetaTrader?
- How much money do I need for Forex trading?
- Demo accounts
- How to determine position size?
- Leverage and margin
- Swap and rollover
- Transaction, profit, loss. Types of orders
- Economic calendar
- When is Forex market open?
- Bid and Ask price. Spread
- Calculating profits
- What are pips and lots?
- How to trade?
- Currency pairs. Base and quote currencies. Majors and crosses
- What technical tools do I need for trading?
- The advantages of Forex market
- What is Forex?
Choose your payment system


