Envelopes
Informação não é consultoria em investimentos
O indicador técnico Envelopes visa a identificar as bordas superior e inferior de um range (intervalo) no trading.
O indicador é composto por 2 médias móveis, uma das quais é deslocada para cima, enquanto a outra é deslocada para baixo. Os Envelopes podem ser usados como bandas em torno da movimentação do preço que indicam níveis de sobrecompra e sobrevenda, também podendo ser usados como metas de preço.
Muitos traders consideram os Envelopes uma variação das Bandas de Bollinger . O princípio básico de ambas as ferramentas é o mesmo: após quaisquer flutuações, o preço sempre voltará para a tendência principal.
Como implantar
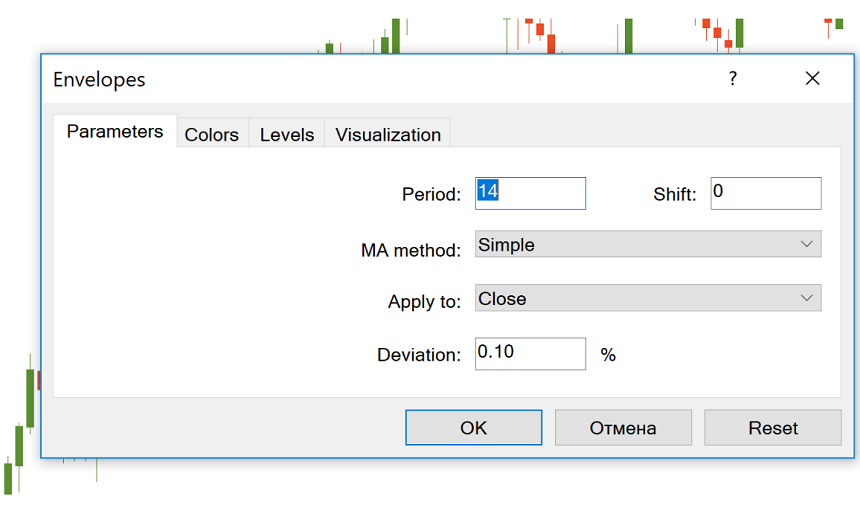
O Envelopes está incluído no conjunto padrão do MetaTrader. Você pode adicioná-lo ao gráfico clicando em Inserir — Indicadores — Tendência, escolhendo em seguida a opção Envelopes. As linhas do indicador aparecerão na mesma janela que o gráfico de preço.

O período definido como padrão no MetaTrader equivale a 14 e o desvio (deslocamento das MAs) é definido em 0,1%. Você pode ajustar o valor do desvio dependendo da volatilidade do mercado: quanto maior esta, maior deve ser o desvio. No entanto, não se recomenda fixar o desvio acima de 2%.
Para o trading intraday (intradia), pode-se usar o gráfico H1 e a média de 10 períodos. Um desvio de 0,3%–0,5% deve ser suficiente para qualquer par de moedas.
O campo “Deslocar” — que tem o valor padrão de 0 — permite mover a média para frente ou para trás no eixo do tempo. Um valor de 20 move as linhas do indicador 20 barras para frente, enquanto um valor de -20 move as mesmas 20 barras para trás.
Como interpretar Envelopes
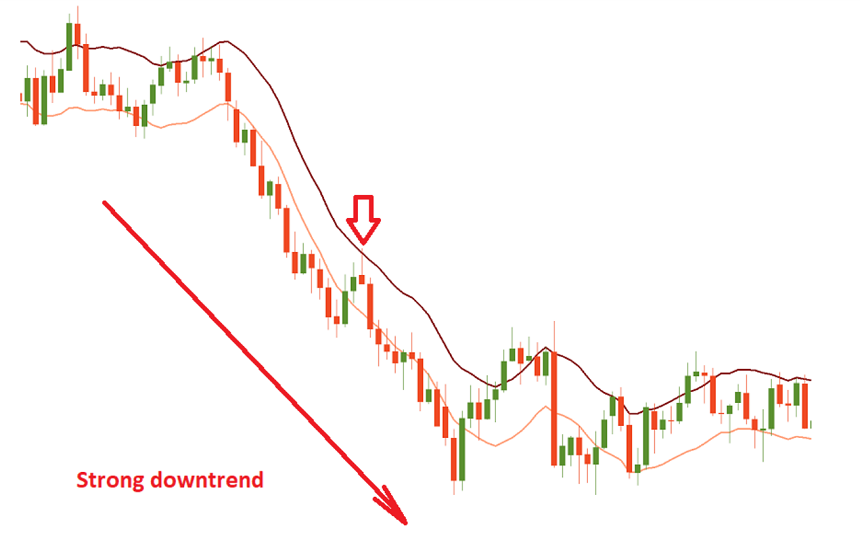
O indicador Envelopes se baseia nas Médias Móveis (MAs) e, consequentemente, tem as características específicas e as aplicações comuns às outras MAs. Primeiramente, a inclinação das linhas do indicador mostra a direção da tendência: se as bandas do Envelopes estiverem com inclinação para cima, trata-se de uma tendência de alta; se a inclinação estiver para baixo, trata-se de uma tendência de queda. Ademais, o indicador mostra claramente o início do mercado lateral à medida que suas linhas ficam horizontais.
Há várias formas de interpretar o indicador Envelopes.
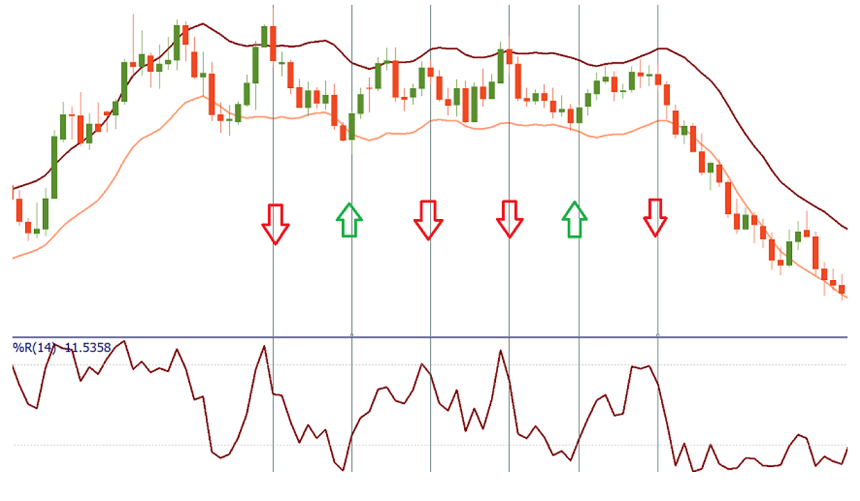
Primeiramente, é possível operar dentro do canal criado pelas bandas do Envelopes: comprar quando o preço atingir a banda inferior em uma tendência de alta e vender quando o preço chegar à banda superior em uma tendência de queda.

Quando o mercado está indo em direção a um range, as movimentações do preço acima da banda superior do Envelopes sinalizam que o ativo está sobrecomprado e provavelmente sofrerá reversão para baixo. Movimentações acima da banda inferior significam que o mercado está em sobrevenda e pode sofrer reversão para cima.

Ao mesmo tempo, quando o preço rompe acima da banda superior em uma tendência de alta, isso é sinal de que esta tendência de alta é forte e talvez possamos ver um movimento de subida prolongado. Quando o preço rompe abaixo do envelope inferior em uma tendência de queda, significa que a tendência de queda é forte e o preço pode cair drasticamente. O indicador Envelopes pode fazer parte de várias estratégias de trading. Por exemplo: ele pode ser usado no scalping em intervalos de tempo menores. Por ser um indicador de tendência, é possível obter bons resultados combinando-o com algum oscilador.
Outros artigos nesta seção
- Timeframes
- Gráfico Renko
- Tipos de gráficos
- Heiken Ashi
- Política de relaxamento quantitativo
- Pontos de Pivô
- Média Móvel: jeito simples de encontrar uma tendência
- Williams’ Percent Range (%R)
- Índice de vigor relativo
- Momentum
- Índice de Força (Force Index)
- Poder dos Touros e Poder dos Ursos
- Average True Range
- Como negociar com base nas decisões de bancos centrais?
- CCI
- SAR Parabólico
- Stochastic (Estocástico)
- Relative Strength Index
- Osciladores
- ADX
- Bandas de Bollinger
- Indicadores de tendência
- Introdução aos indicadores técnicos
- Suporte e resistência
- Tendência
- Análise técnica
- Bancos centrais: política e efeitos
- Fatores fundamentais
- Análise fundamental
- Análise técnica vs fundamental


