


Williams’ Strategy
Bill Williams is the creator of some of the most popular market indicators: Awesome Oscillator, Fractals, Alligator, and Gator.

Don’t waste your time – keep track of how NFP affects the US dollar!
Data Collection Notice
We maintain a record of your data to run this website. By clicking the button, you agree to our Privacy Policy.

Beginner Forex Book
Your ultimate guide through the world of trading.

Check Your Inbox!
In our email, you will find the Forex 101 book. Just tap the button to get it!
Risk warning: ᏟᖴᎠs are complex instruments and come with a high risk of losing money rapidly due to leverage.
66.43% of retail investor accounts lose money when trading ᏟᖴᎠs with this provider.
You should consider whether you understand how ᏟᖴᎠs work and whether you can afford to take the high risk of losing your money.
Warning! Old version of the browser!
Press one of the icons below to proceed to the official website of the developer and download the latest version of your browser.

Online Forex broker
2022-05-19 • Updated
Information is not investment advice
The third touch (also known as the third strike) trading strategy is another strategy that we are going to introduce to our traders. Unlike complicated strategies with the usage of many indicators, the “third touch” requires only one element – a trend line.
Recommendations:
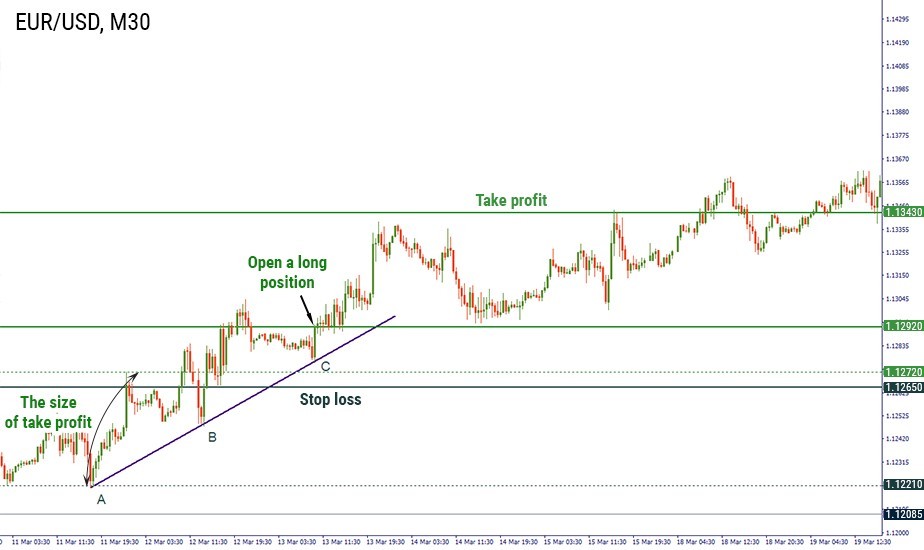
Let’s consider the steps that you need to follow. At first, let’s look at the scenario when you want to open a long position.
The highest level after the “A” point – the lowest level at the “A” point = the number of pips you need to add to your entry level.
We will use the EUR/USD chart with M30 timeframe as an example.
On March 11, the pair started to move up. We waited for the point “B” to draw the ascending trendline. After that, we waited for the third touch at the point “C” and opened a position on the closing price of the bullish candlestick at 1.1292. We place the stop loss level at 1.1265 (lower than the previous support). Our take profit equals the size between point A (1.1221) and the highest point after point A (1.1272). Thus, we place it at 1.1343 (the entry point + (1.1272-1.1221).
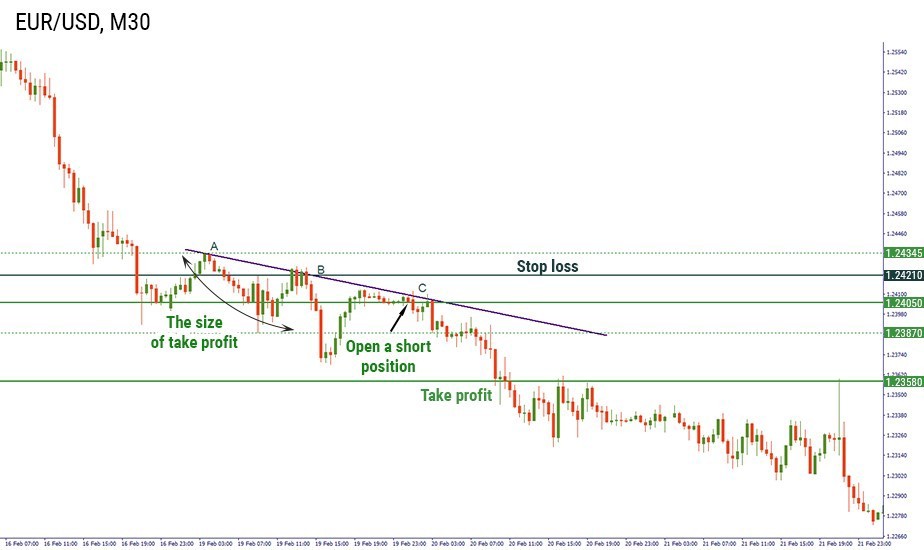
For the short position, you need to follow the following steps.
The highest level at the “A” point – the lowest level after the “A” point = the number of pips you need to deduct from your entry level.
On February 14, the EUR/USD pair bounced from the 1.2434 level and corrected to the downside. After the short-term correction, the price jumped to the upside but failed to move higher than the point “B”. The situation helped us to suggest about the possible downtrend’s formation. We waited for the point “C” to confirm our thoughts and entered a short position after the bearish candlestick was formed. The entry was placed at the closing price of the candlestick at 1.2405. Our stop loss was set above the previous resistance at 1.2421. Take profit was calculated as the entry point minus the distance between the “A” point and the lowest point after “A”: 1.2405- (1.2434-1.2387) = 1.2358.
Conclusion
In this article, we explained an easy-to-use strategy for trend traders. Its advantage is that it requires only trendline and the support and resistance levels. However, you need to be careful while trading the pairs and be sure that there are no events which may affect the movement of a trend.

Bill Williams is the creator of some of the most popular market indicators: Awesome Oscillator, Fractals, Alligator, and Gator.

Trend strategies are good - they may give significantly good results in any time frame and with any assets. The main idea of the ADX Trend-Based strategy is to try to catch the beginning of the trend.

Counter-trend strategies are always the most dangerous but also the most profitable. We are pleased to present an excellent counter-trend strategy for working in any market and with any assets.


Your request is accepted.
We will call you at the time interval that you chose
Next callback request for this phone number will be available in 00:30:00
If you have an urgent issue please contact us via
Live chat
Internal error. Please try again later