


Support and resistance
Information is not investment advice
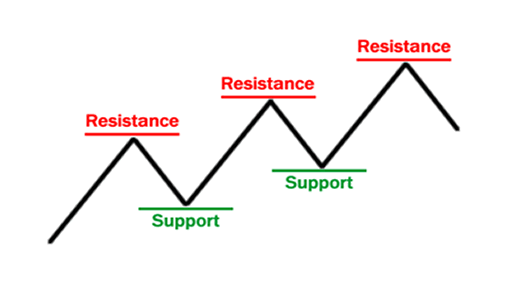
The concept of support and resistance is very important for traders. Basically support and resistance represent areas where the price action is expected to face obstacles. Let’s study this in detail.
Support is a price level where the falling price tends to slow down or reverse. This means the price is more likely to "bounce" off this level rather than break through it. However, once the price has passed this level, it is likely to continue dropping until it finds another support level.
Resistance is a price level where the rising price tends to slow down or reverse. The price is more likely to bounce back from this level rather than break through it. However, a break above this level opens the way for further price growth until it finds another resistance level.
How to use S&R in trading?
Support and resistance allow traders to guide themselves through the market. Once you mark these levels on the chart, you will see the structure of the market and be able to predict the direction of the price’s next steps as well as their size.
The idea is that these levels will most likely stop the price action and make it reverse. As a result, it’s a common approach to open buy trades at support and sell trades at resistance. If you want to get the benefit of trading a trend, then you will buy at support during an uptrend or sell at resistance in a downtrend. If you don’t trade trends, then you still can use support and resistance levels as your entry points and close positions at the next support/resistance levels.
Indeed, S&R levels also give a trader a hint where to close a trade. Thus, if you have an open selling position and the price is approaching a support level, you might think about closing your trade. The same thing is with a buy trade, the difference being that after you opened a buying position you need to mind resistance levels.
Support and resistance can be located on every timeframe. Yet, keep in mind that the bigger the timeframe, the more important is a support/resistance level. In addition, despite the fact that we talk about levels here, trading is not a precise science, so you actually need to think about S&R as areas. When you’ve identified support or resistance, you need to include a couple of pips around it. This will help you make your trading more accurate.
How to locate support and resistance?
Support and resistance come in different forms. Firstly, there are the diagonal trendlines we explained before. A trendline can connect the price’s highs and limit the trend on the upside. In this case, this trendline is called a resistance line. A trendline can also be drawn through the lows of the price chart and limit the price action on the downside. Such a line is called a support line. Support and resistance lines can be drawn in both uptrends and downtrends. You need at least 2 highs or 2 lows to draw a trendline through them. You can find more information about drawing trendlines here.
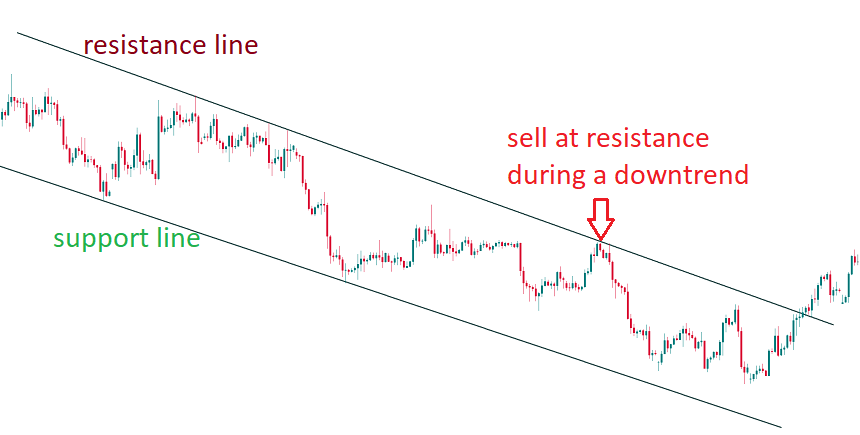
Notice that during an uptrend, support line is the most important one because if the price breaks below it, the trend will change to a downtrend. During a downtrend, resistance line is the key one as a break above it would mean a reversal up.
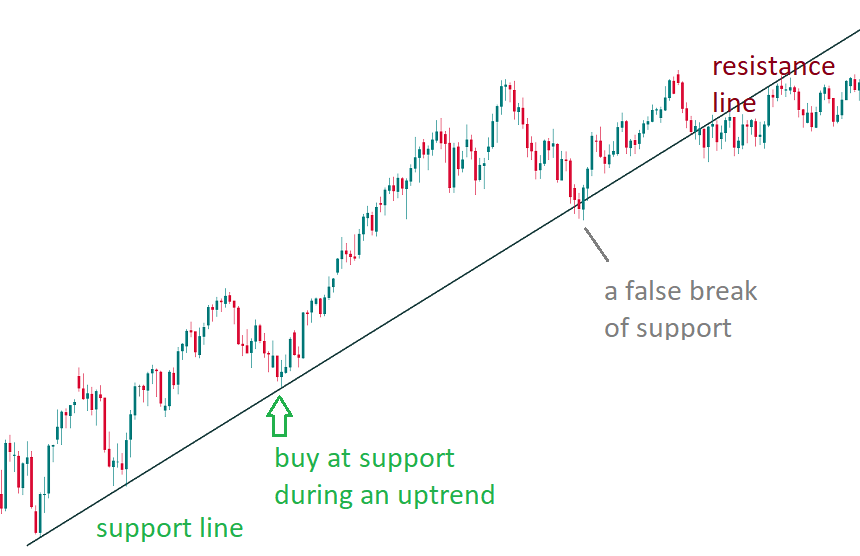
As the market is constantly moving, it often happens that support and resistance lines and levels switch places. As you can see at the picture above, after the price fell below the support line it started to act as a resistance line.
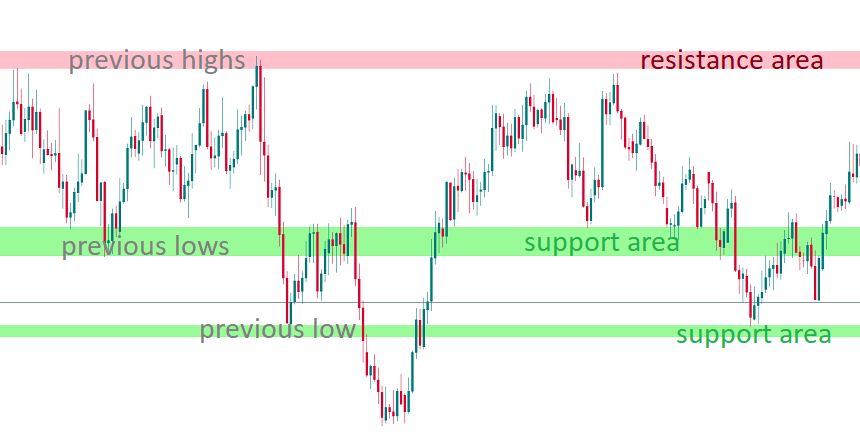
There are also horizontal support and resistance levels. One of the simplest and most effective ways is to draw them through the previous highs and lows of the price chart:
Other techniques traders use to identify support and resistance levels are moving averages, Fibonacci levels, pivot points, etc.
Other articles in this section
- Timeframes
- Renko charts Japanese candlestick chart
- Types of charts
- Heiken Ashi
- Quantitative easing policy
- Pivot Points
- ZigZag
- Moving Average
- Williams’ Percent Range (%R)
- Relative Vigor Index (RVI indicator)
- Momentum
- Force index
- Envelopes
- Average True Range
- How to trade on central bank decisions?
- CCI (Commodity Channel Index)
- Parabolic SAR
- Stochastic Oscillator
- Relative Strength Index
- Oscillators
- ADX indicator
- Bollinger bands
- Trend indicators
- Introduction to technical indicators
- Trend
- Technical analysis
- Fundamental factors
- Fundamental analysis
- Fundamental vs technical analysis
Choose your payment system


