Ichimoku
Informação não é consultoria em investimentos
Ichimoku Kinko Hyo (IKH), ou simplesmente Ichimoku, é um indicador técnico muito útil e informativo. A tradução de seu nome é “consulta a um gráfico em equilíbrio“. A ideia é que você saberá tudo que precisa sobre o estado do mercado com apenas uma consulta ao gráfico que contém este indicador.
O indicador Ichimoku cumpre várias tarefas importantes:
marca a direção da tendência dominante;mostra o momento (fôlego) e a força da tendência;fornece níveis de suporte e resistência adequados;dá sinais comerciais.Este indicador pode assustar no começo, mas você verá que ele é relativamente simples e altamente valioso na análise de mercado.
No tutorial a seguir, falaremos sobre os elementos do Ichimoku e os sinais que eles produzem e explicaremos como analisar o mercado com essa ferramenta técnica.
Os elementos do Ichimoku
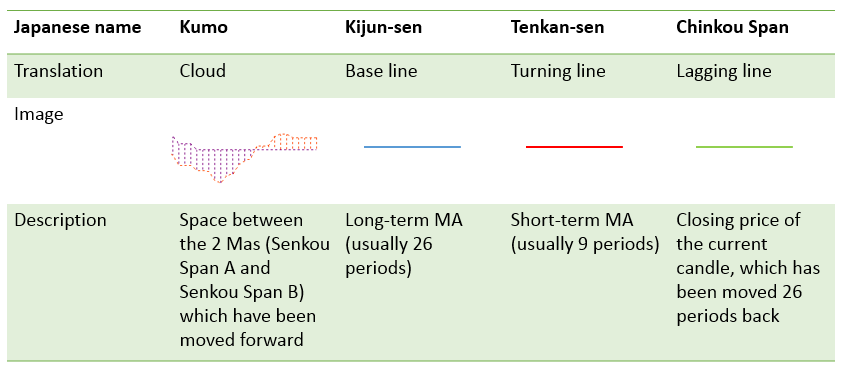
O indicador se baseia em médias móveis que têm algumas modificações. Suas linhas têm nomes tradicionais em japonês e nomes modernos e convencionais.
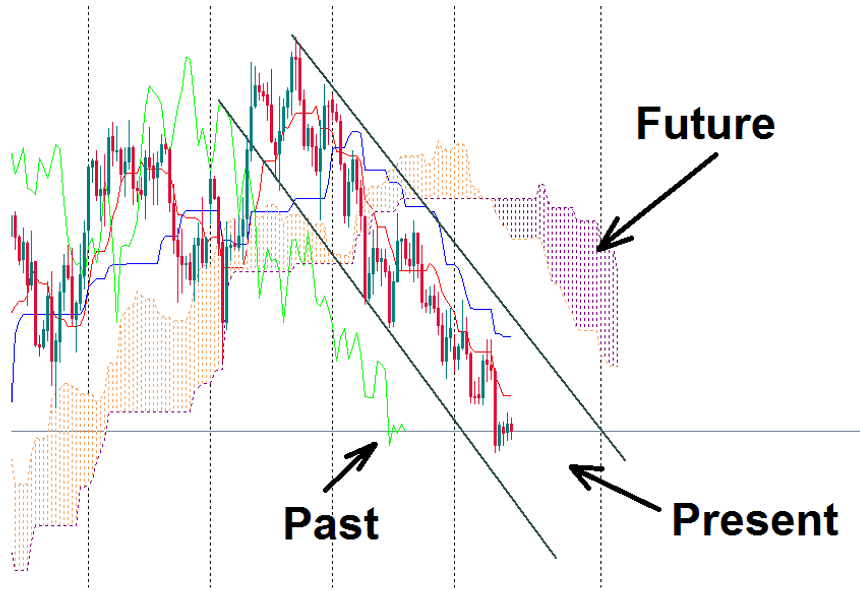
Confira o exemplo de indicador Ichimoku no gráfico. Podemos distinguir as 3 camadas: passado, presente e futuro.
Vamos começar com o “presente“, caracterizado por 2 linhas chamadas de Kijun e Tenkan. Dessas duas, a Kijun (linha base) é uma média móvel com intervalo maior. Logo, ela mede o momento a médio prazo e tem mais peso do que a Tenkan. O preço cruza a Tenkan com mais frequência que a Kijun e, se o preço cruzar a Kijun, isso sinaliza mudanças no mercado.
O “futuro“ é representado pela Nuvem Ichimoku, esta formada pelas 2 médias móveis deslocadas para frente. Se a média móvel de intervalo maior (Senkou Span B) estiver abaixo da média móvel de intervalo menor (Senkou Span A), considera-se que a Nuvem é bullish e esta apresenta cor clara. Se a Senkou Span B estiver acima da Senkou Span A, a considera-se que a Nuvem é bearish e esta geralmente apresenta cor mais escura. Uma Nuvem bullish indica que os compradores dominam o mercado, enquanto uma Nuvem bearish mostra que os vendedores estão no controle. Você pode ver que a Nuvem muda de cor de tempo em tempo, refletindo a alternância do controle entre touros e ursos. A largura da Nuvem é importante: quanto mais larga a Nuvem bearish, maior é a força dos vendedores. Para entender o equilíbrio de forças atual do mercado, veja a parte da Nuvem que “está no futuro“, ou seja, à direita do preço atual. A parte da Nuvem alinhada como os preços atuais age como suporte e resistência para o preço.
No “passado“, há uma única linha chamada Chinkou Span. Diferente das outras linhas Ichimoku, ela não é uma média móvel e sim um gráfico de preço deslocado um número de intervalos para trás, configurando uma defasagem em relação ao mercado. A forma que esta linha interage com o próprio gráfico de preço oferece pistas aos traders.
Por que alguns elementos do indicador estão deslocados para frente e alguns colocados para trás? Primeiramente, seria muito difícil ler o gráfico se todas as 5 linhas estivessem na mesma área. Além disso, dessa forma os elementos do indicador Ichimoku produzem sinais comerciais. O tutorial a seguir lhe mostrará como interpretar esses sinais.
Como implementar o Ichimoku
Para aplicar o Ichimoku a um gráfico no Metatrader, clique em Inserir, escolha Indicadores, vá em Personalizados e então selecione Ichimoku. Nos ajustes, você pode escolher os valores para a Tenkan, a Kijun e a Senkou Span B. Você também pode ajustar as cores das linhas do indicador conforme suas preferências.
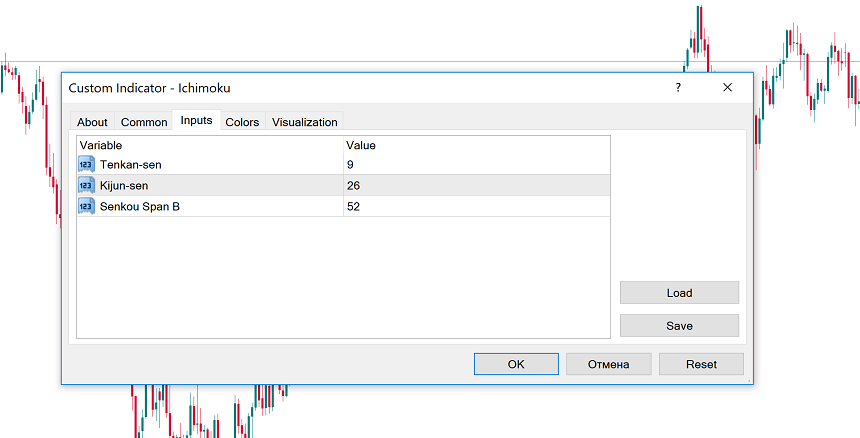
Os ajustes padrão 9-26-52 são os parâmetros originais propostos pelo desenvolvedor do indicador. Eles são populares entre os traders e podem ser usados em qualquer intervalo de tempo. Você também tem a liberdade de ajustar as configurações padrão: o importante é escolher valores crescentes, de modo que o número para a Tenkan-sen seja o menor e o valor para a Senkou Span B seja o maior.
Negociando com o Ichimoku
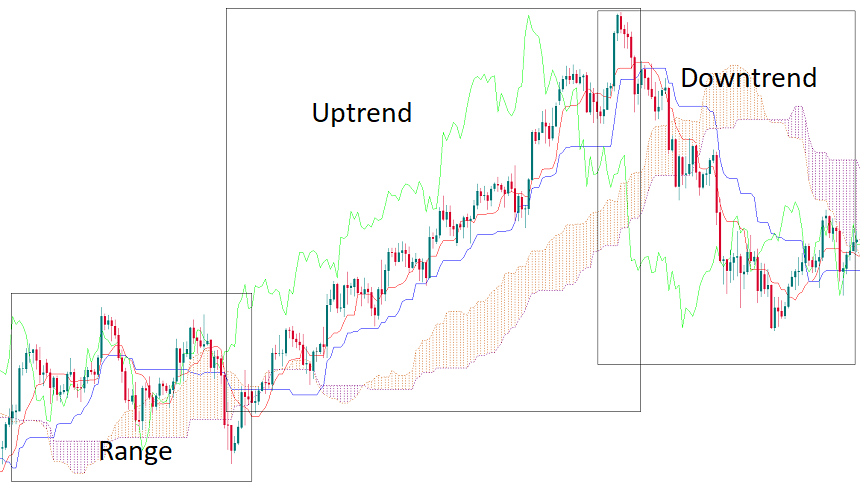
A posição das linhas do Ichimoku pode dar aos traders uma visão clara das tendências existentes. Quando o mercado está lateral, as linhas do indicador ficam horizontais, com o preço flutuando em torno delas. A Nuvem é fina e muda de cor frequentemente.
Se o preço está acima da Nuvem, da Tenkan e da Kijun e a Nuvem bullish está consolidada, tem-se uma tendência de alta. Neste caso, a Chinkou Span estará acima do preço.
Se o preço está abaixo da Nuvem, da Tenkan e da Kijun e a Nuvem bearish está consolidada, tem-se uma tendência de queda. Neste caso, a Chinkou Span estará abaixo do preço.
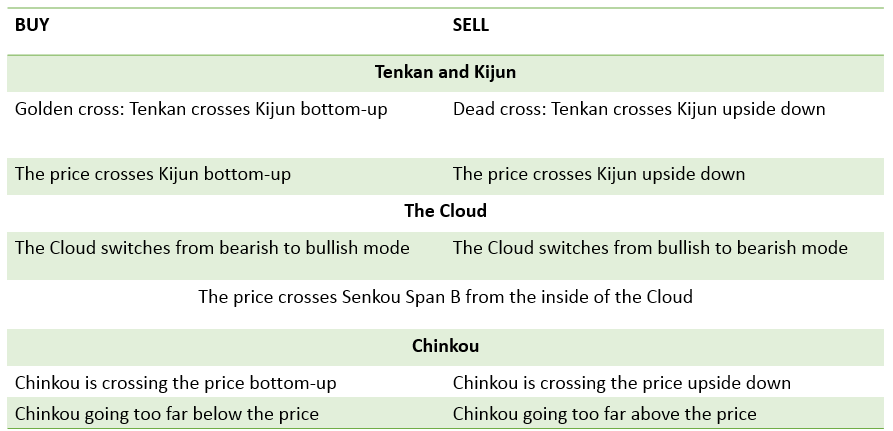
As linhas Ichimoku produzem sinais comerciais se cruzando entre si e cruzando o preço, o que explica a existência de muitos sinais diferentes na tabela abaixo. Note que quando uma nova tendência se inicia, os sinais dos diversos elementos do indicador tendem a aparecer mais ou menos no mesmo tempo e apontam para a mesma direção.
Vamos rever um exemplo de como o Ichimoku oferece sinais comerciais.
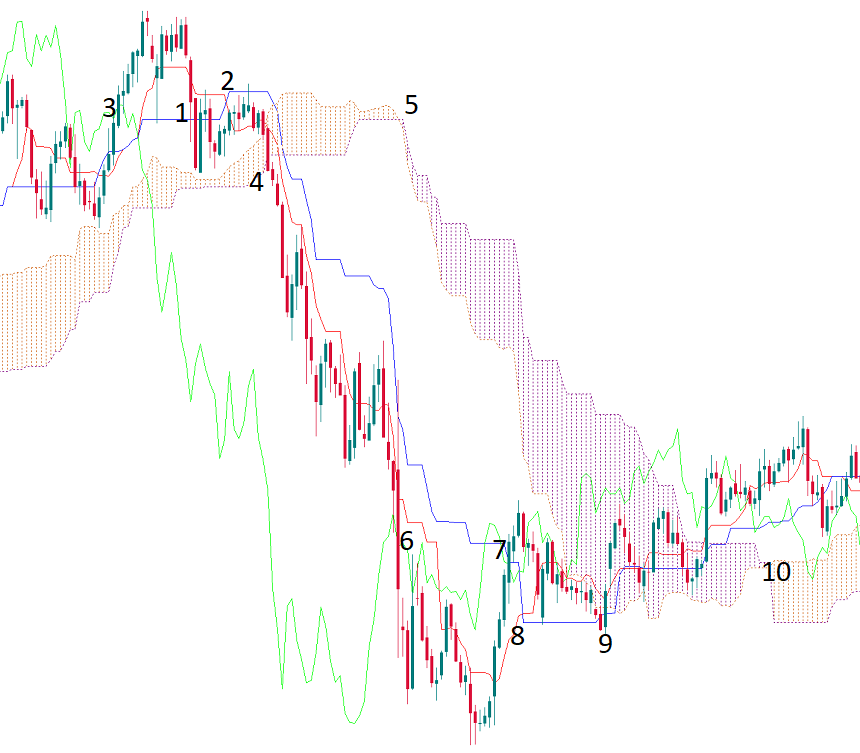
1 - O preço foi abaixo da Kijun-sen. É o primeiro sinal bearish.
2 - A Tenkan-sen caiu abaixo da Kijun-sen.
3 - A Chinkou Span cruzou o gráfico de preço para o lado de baixo.
4 - O preço rompeu abaixo da Nuvem Ichimoku.
5 - A Nuvem mudou de bullish para bearish.
Os sinais 2-4 apareceram mais ou menos na mesma hora e sinalizaram o começo de uma tendência bearish. Eles apontam para a oportunidade de abrir uma negociação de venda. As linhas do indicador então agiram como resistência para o preço.
6 - A Chinkou Span rompeu novamente, desta vez acima do gráfico de preço. É possível tirar lucros de uma posição curta.
7 - O Preço foi acima da Kijun-sen.
8 - A Tenkan-sen foi acima da Kijun-sen.
9 - A Nuvem Ichimoku bearish grossa agiu como resistência para o preço, mas ele finalmente conseguiu romper.
10 - A Nuvem mudou de bearish para bullish. O preço foi acima da Nuvem. Há indícios de uma tendência de alta emergente, mas, dado o fato de que a Chinkou Span corrigiu o gráfico de preço, pode também haver uma tendência lateral por algum tempo.
Conclusão
O indicador Ichimoku representa um sistema completo de trading. É possível usar apenas esta indicador no trading: você pode usá-lo para identificar tendências, conferir níveis de suporte e resistência, além de obter sinais de entrada. Você pode personalizar os ajustes do indicador e usá-los em conjunto com outras ferramentas de análise técnica.
Outros artigos nesta seção
- Estrutura de um robô de negociação
- Construir um robô de negociação sem programar
- Como lançar robôs de trade no MetaTrader 5?
- Trading algorítmico. O que é isto?
- Trading algorítmico com MQL5
- O que significa “truncamento“?
- Padrão diagonal principal
- Padrão de ondas de Wolfe
- Padrão dos Três Avanços (Three Drives)
- Tubarão
- Borboleta
- Caranguejo
- Bat
- Gartley
- ABCD
- Padrões harmônicos
- Introdução à análise das Ondas de Elliott
- Como negociar rompimentos
- Negociando com notícias Forex
- Como colocar uma ordem Take Profit?
- Gestão de riscos
- Como colocar uma ordem Stop Loss?
- Indicadores técnicos: negociação de divergências
Escolha seu sistema de pagamento