


Gartley
Information is not investment advice
The Gartley pattern is the oldest recognized harmonic pattern. It was developed by and named after H.M. Gartley himself. However, Gartley didn’t mention Fibonacci ratios for the pattern. Fibonacci levels were added later by Scott Carney and Larry Pesavento.
Gartley patterns include the basic ABCD pattern that is preceded by a significant high or low. So, the Gartley pattern is formed by 4 swings of the price. The bullish Gartley pattern looks similar to a letter M, while the bearish one resembles a W. The letters to mark a Gartley pattern on the chart are XABCD. The XA line should be the longest line of the pattern.
Let’s study the bullish Gartley pattern (the bearish one is its mirror).
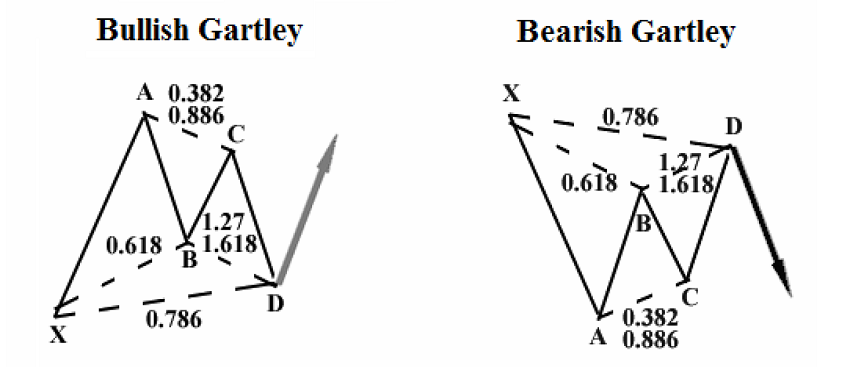
All starts at the point X that can be found at a higher timeframe and be a part of a bigger trend. It’s a low/high that is very distinct and evident to everyone who is looking at the chart. The price then makes a swing up from X to A and reverses down at A. The leg XA limits the scope of the pattern, and tits other legs should develop within these points.
A pattern with the structure as shown at the picture can be called a Gartley pattern, if it fits the following rules:
- Point B is at the 61.8% retracement of XA. This is the most important condition.
- Point C can be at the 38.2%-88.6% retracement of AB.
- Point D can be found at the 127.2%-161.8% extension of AB or at the 78.6% retracement of XA.
How to trade with Gartley pattern
The point D is the trigger to buy in a bullish Gartley pattern. Notice that the point D is a potential reversal zone. Traders will need a confirmation of an actual reversal in this area. The confirmation may come in the form of a reversal candlestick pattern or the readings of technical indicators.
Take Profit and Stop Loss
Here are the options for a Take Profit order.
TP1: 61.8% of CD
TP2: the size of XA projected from D
A Stop Loss may be placed below X for bullish Gartley (above X for bearish Gartley) or according to your risk management rules.
Notice that in real life, patterns you find on charts often don’t fit in the ratios listed above perfectly. As a result, the bigger is the difference between the textbook Gartley pattern and the pattern you want to trade, the higher risk of an error should be taken into account.
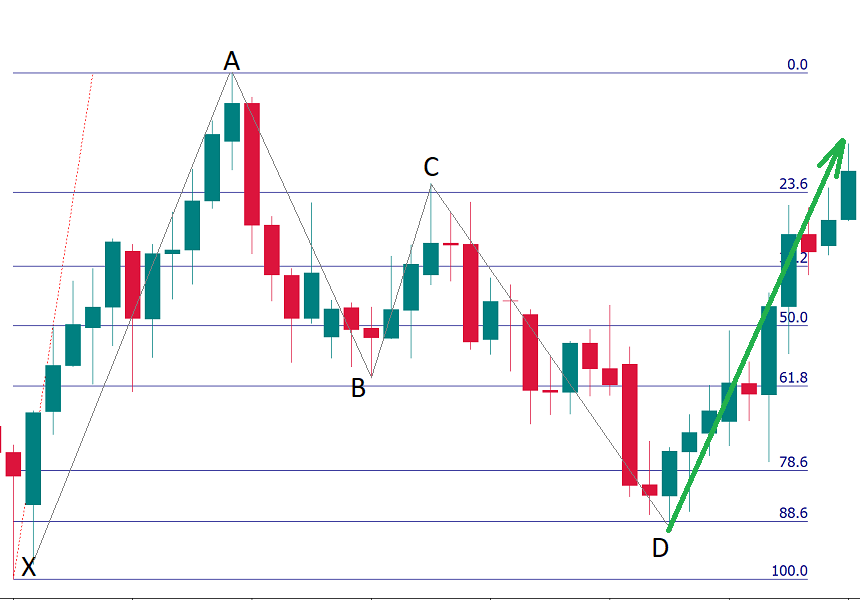
Here’s how a Gartley pattern looks on the chart. The point B is at about the 61.8% retracement of XA. The point C is at the 61.8% retracement of AB. The point D is at the 88.6% retracement of the XA. The pattern is not textbook-perfect but it’s close enough.
Conclusion
A correctly identified Gartley pattern offers a trade with a low level of risk. Gartley In many cases, Gartley patterns form near the tops/bottoms of the market and precede a reversal. You can find and trade Gartley patterns on all timeframes.
Other articles in this section
- Structure of a Trading Robot
- Building a Trading Robot without Programming
- How to Launch Trading Robots in MetaTrader 5?
- Algorithmic trading: what is it?
- Algo trading with MQL5
- Advanced techniques of position sizing
- What does ‘truncation’ mean?
- Ichimoku
- How to trade gaps
- Leading diagonal pattern
- Wolfe waves pattern
- Three drives pattern
- Shark
- Butterfly
- Crab
- Bat
- ABCD
- Harmonic patterns
- Intoduction to Elliott Wave analysis
- How to trade breakouts
- Trading Forex news
- How to place a Take Profit order?
- Risk management
- How to place a Stop Loss order?
- Technical indicators: trading divergences
Choose your payment system


