

Williams’ Strategy
Bill Williams is the creator of some of the most popular market indicators: Awesome Oscillator, Fractals, Alligator, and Gator.

Don’t waste your time – keep track of how NFP affects the US dollar!
Data Collection Notice
We maintain a record of your data to run this website. By clicking the button, you agree to our Privacy Policy.

Beginner Forex Book
Your ultimate guide through the world of trading.

Check Your Inbox!
In our email, you will find the Forex 101 book. Just tap the button to get it!
Risk warning: ᏟᖴᎠs are complex instruments and come with a high risk of losing money rapidly due to leverage.
70.72% of retail investor accounts lose money when trading ᏟᖴᎠs with this provider.
You should consider whether you understand how ᏟᖴᎠs work and whether you can afford to take the high risk of losing your money.
Warning! Old version of the browser!
Press one of the icons below to proceed to the official website of the developer and download the latest version of your browser.

Online Forex broker
2022-08-26 • Updated
Information is not investment advice
Moving averages (MAs) are key instruments that even amateur traders use widely when they want some help with analyzing a price chart. In this article, we’ll go through the basics of moving averages and then learn some life hacks that will help you to use this tool for boosting your trading results.
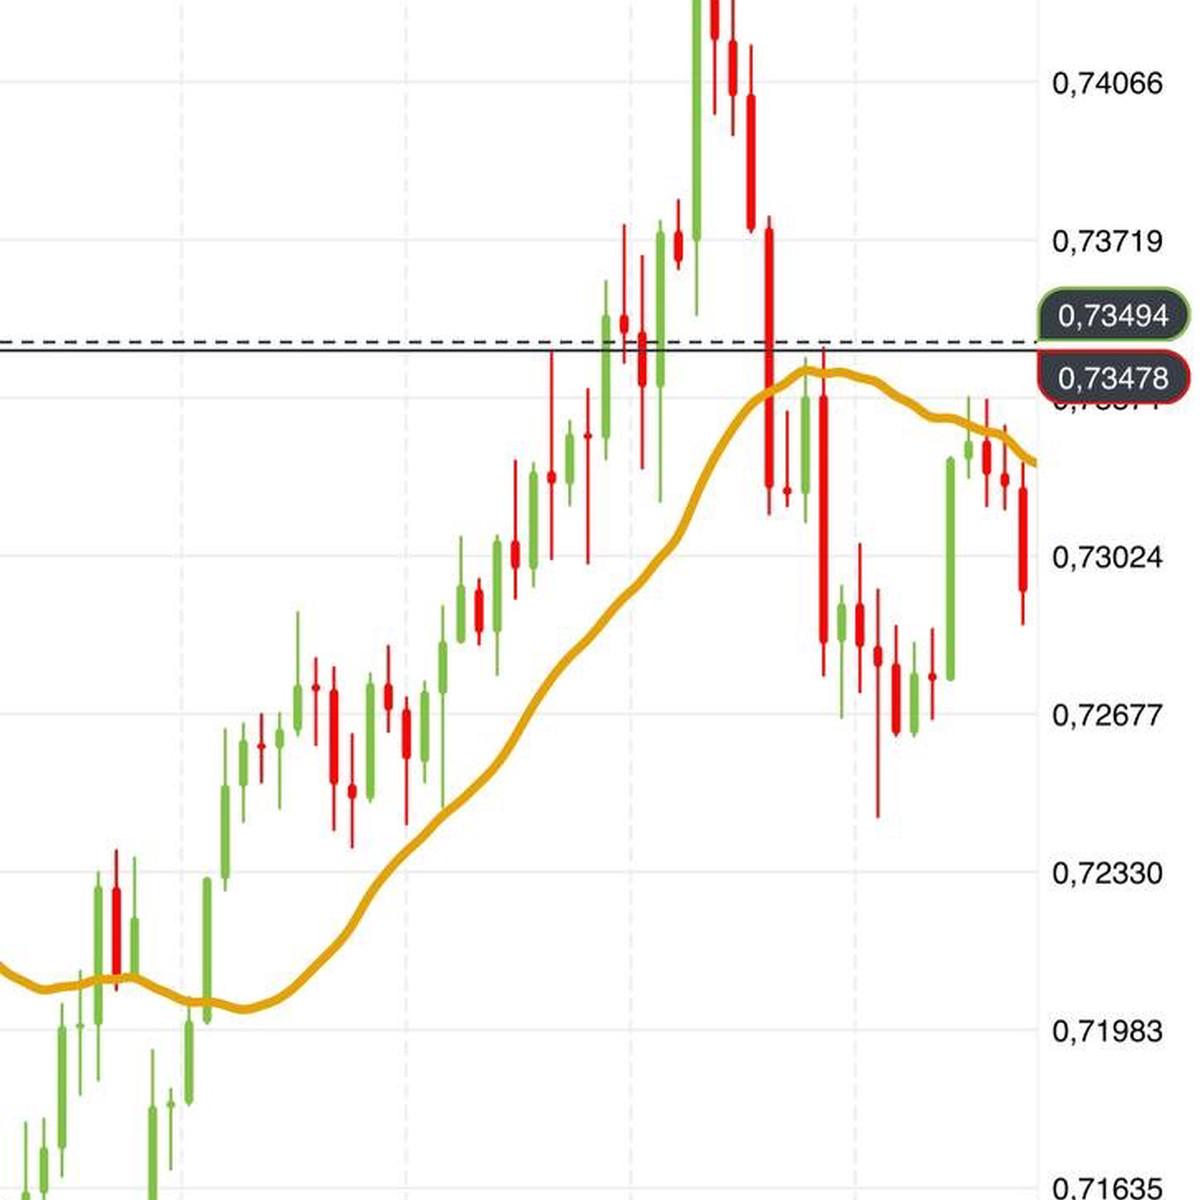
Moving average is a trend indicator. It takes price averages and, as a result, smooths out price action from fluctuations. For example, a 20-period moving average shows the average price for the past 20 periods. Have a look at such a line added to the chart in the FBS Trader App.
With a help of moving averages, you can make smart trading decisions. For example, when the price trend isn’t clear, the MA will show it to you. If the MA goes up, it’s an uptrend. If the indicator goes down, it’s a downtrend. Moreover, you can use MAs as support and resistance lines. If the price approaches a moving average from above, there’s a chance that the line makes it stop on the way down or even turn up. If the price rises to a moving average from below, there is a chance that the line makes it stop on its way up or even reverse down. Just add a MA to the chart in MetaTrader 4 or 5 or in FBS Trader and you will automatically get the support and resistance levels.
The main types of MA are:
Now that we are familiar with the idea of the indicator, let’s look through 8 facts about moving averages that will make your trading more productive and your analysis more proficient.
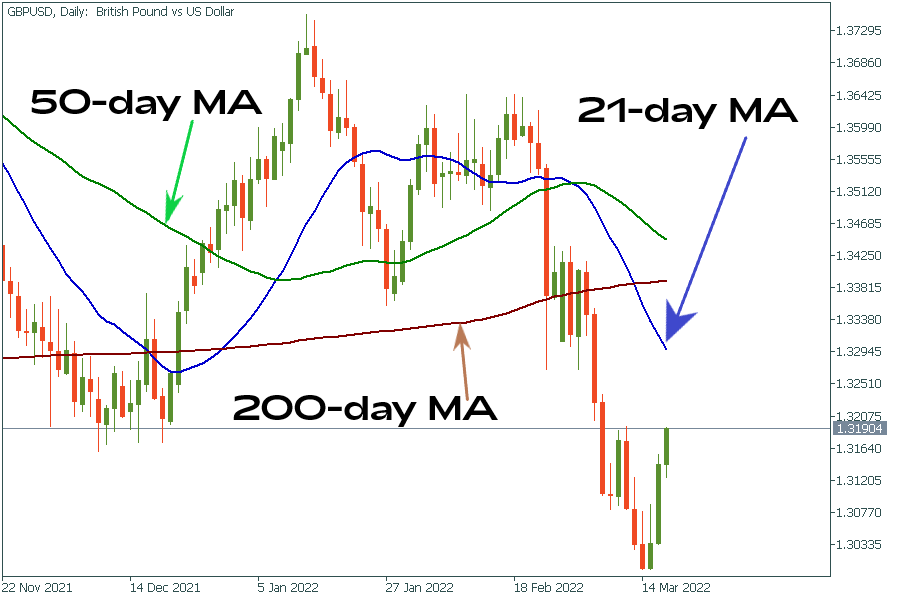
The 21-day moving average usually marks the short-term trend, the 50-day moving average marks the intermediate trend, and the 200-day moving average marks the long-term market trend.
Moving averages only draw trends based on the past price information. Like any technical analysis tool, charting indicators don’t take into account changes in fundamental factors that may affect the future performance of a financial asset. For currencies, such factors include economic growth, inflation, labor market figures, and central bank policy. For stocks, fundamental factors are higher or lower demand for the industry’s products, new rivals on the market, or changes in a company's management structure.
There’s an ongoing debate about whether traders should pay more attention to the very last days of a period (for example, using EMAs). Many people feel that the latest data is a better indication of the price’s direction, while others feel that giving some days more weight than others misrepresents the trend.
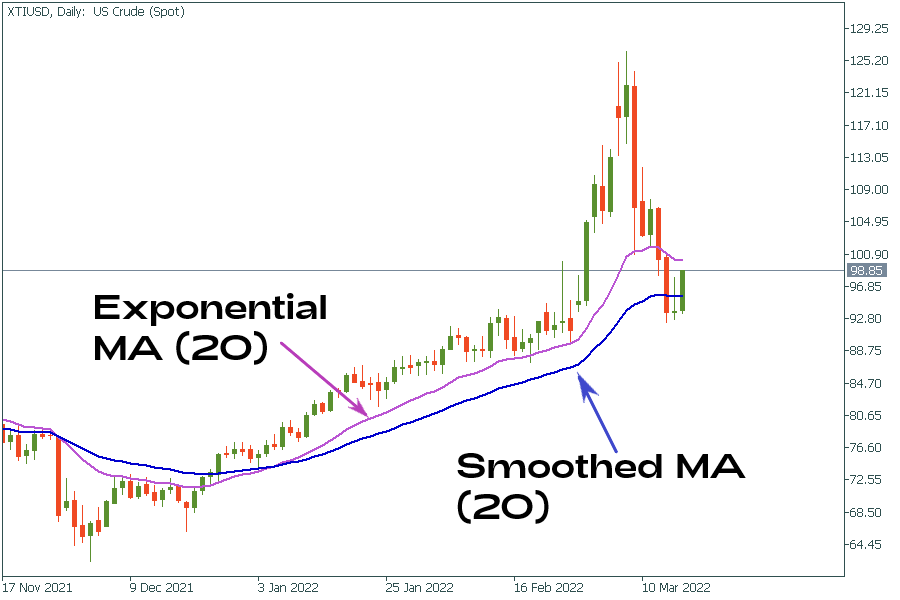
Exponential moving averages give more weight to the recent price changes, while simple moving averages treat every data point in a timeframe equally. SMAs are great as dynamic support and resistance lines, but many trading strategies use EMAs. Thus, in general, if we compare SMA and EMA with the same period on a chart, the difference won’t be that big.
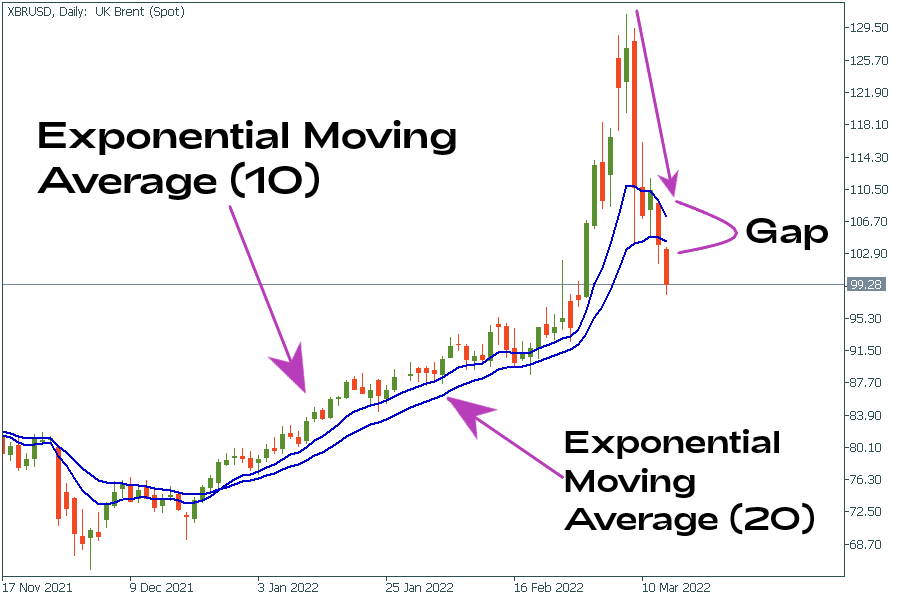
When the price has more momentum (speed), it can travel a bigger distance from a MA before this moving average pulls it back. The gravity of the moving averages brings the price back to the mean. The angle of the two faster moving averages and the difference between them will indicate if the price has enough speed to break away from its average. The best moving averages for determining momentum are from 5 to 40 EMA. For example, a trader may choose 5 and 10 EMAs, or 10 and 20 EMAs, or 20 and 40 EMAs at the close.
A gap between the two EMAs will indicate momentum and, therefore, the price speed. When this gap widens significantly, it means that the price may soon lose momentum, reverse and return to the averages.
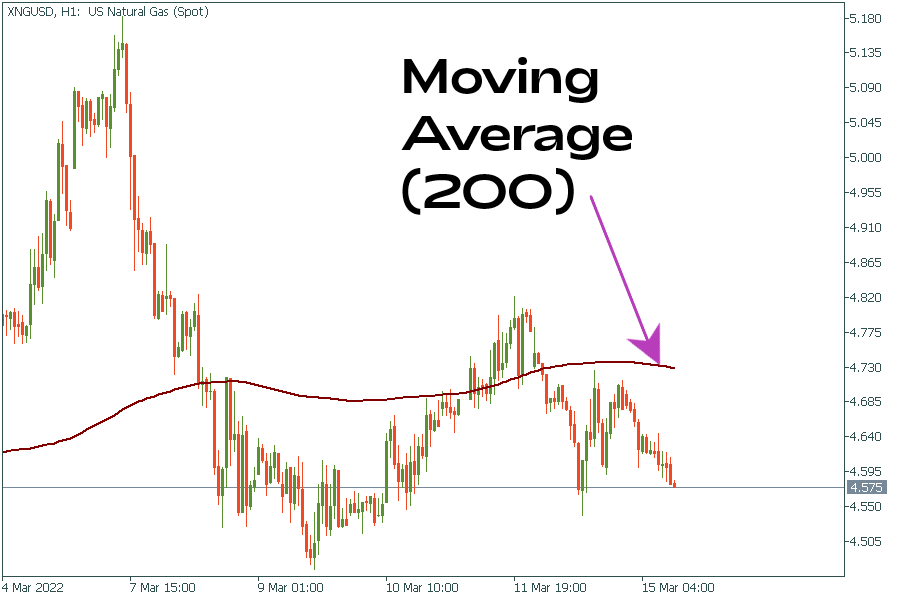
The position of the price on a chart relative to the 200-period moving average indicates whether there’s a bull or a bear market. This line generates one of the most important market signals. In general, bulls remain confident when the price stays above the 200-period moving average. It means that when such situation occurs, buying on pullbacks to the downside is preferable. Bears, on the contrary, prefer opening sell trades on rallies when the price is below the 200-period MA. Many important trend-following trading systems are built using this indicator as the main one.
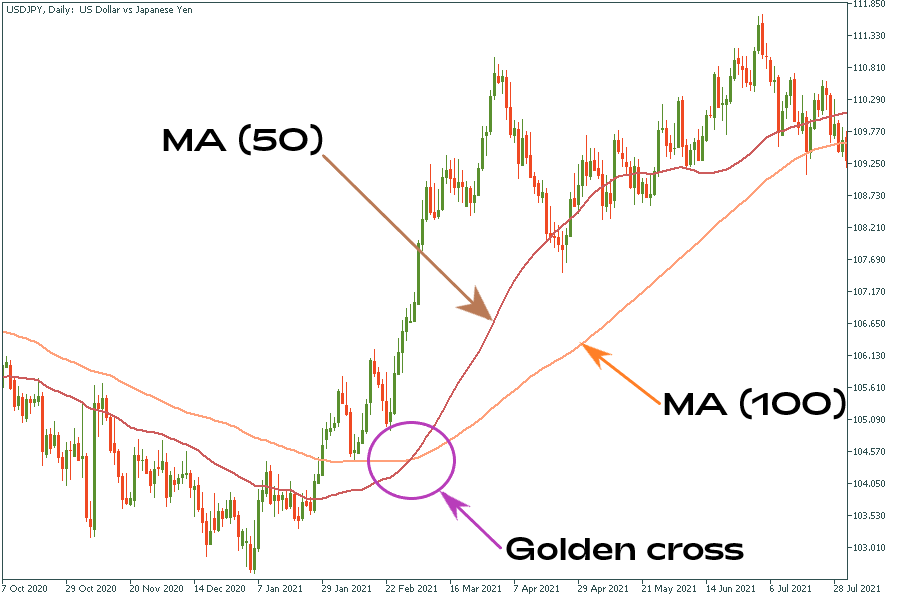
Some traders look for situations when a moving average starts sloping up or down and see this as a signal of a start/change in trend. In addition, it may be easier to notice trend changes and get signals by having two moving averages with different periods on one chart. Let’s consider a 50-period MA and a 100-period MA. A bullish signal occurs when the 50-period MA (a line with a smaller period) rises above the 100-period line. The signal is called the “golden cross”. Alternatively, traders see a bearish signal when the 50-period MA gets below the 100-period line. This would be a “dead cross”.
Notice that the signals of the crosses are more reliable if the MAs move apart after the crossing and the price has momentum.
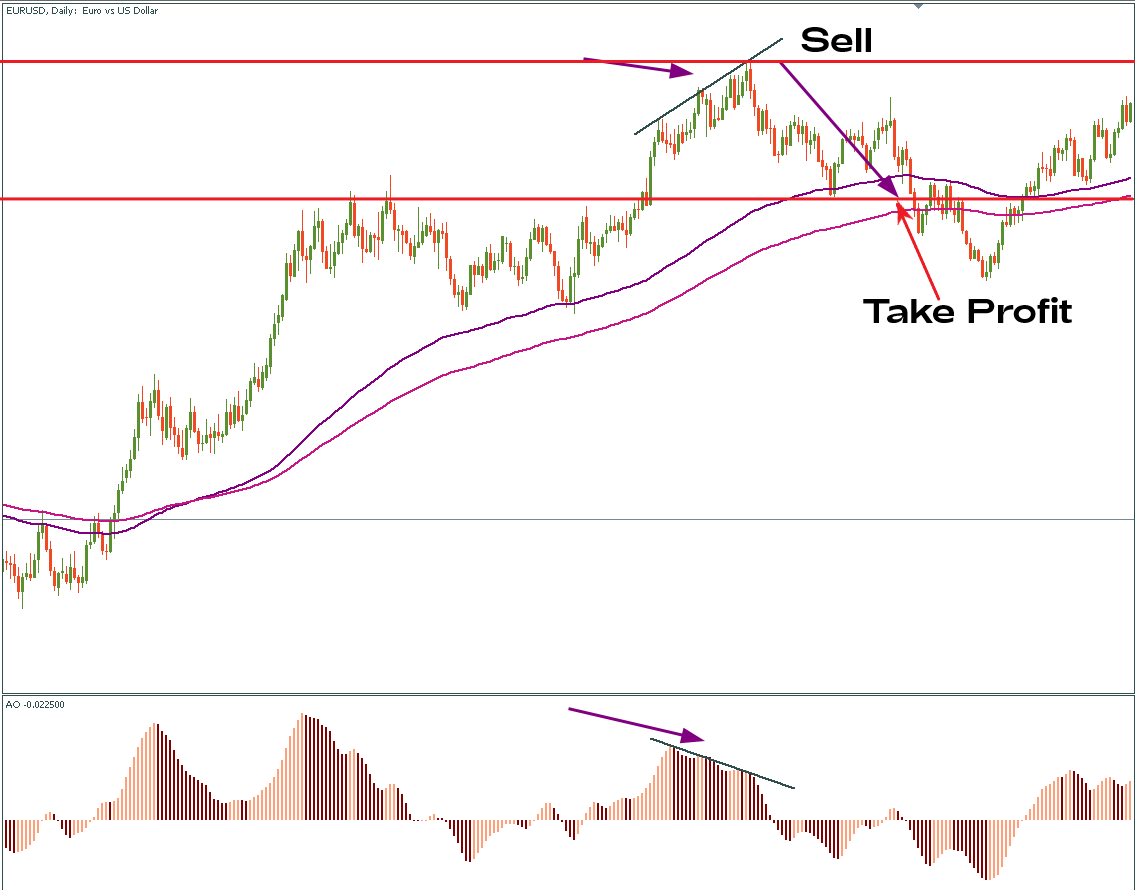
Moving averages are ideal targets when there’s a divergence. On average, when divergence between the price chart and some oscillator occurs, a trader can expect the price to return at least to the middle ground between the 100 and the 150 EMAs. It’s possible that the price sometimes doesn’t return within the moving average band. However, if the price reaches or approaches these MAs, the trader can consider that the trade on the divergence is over.
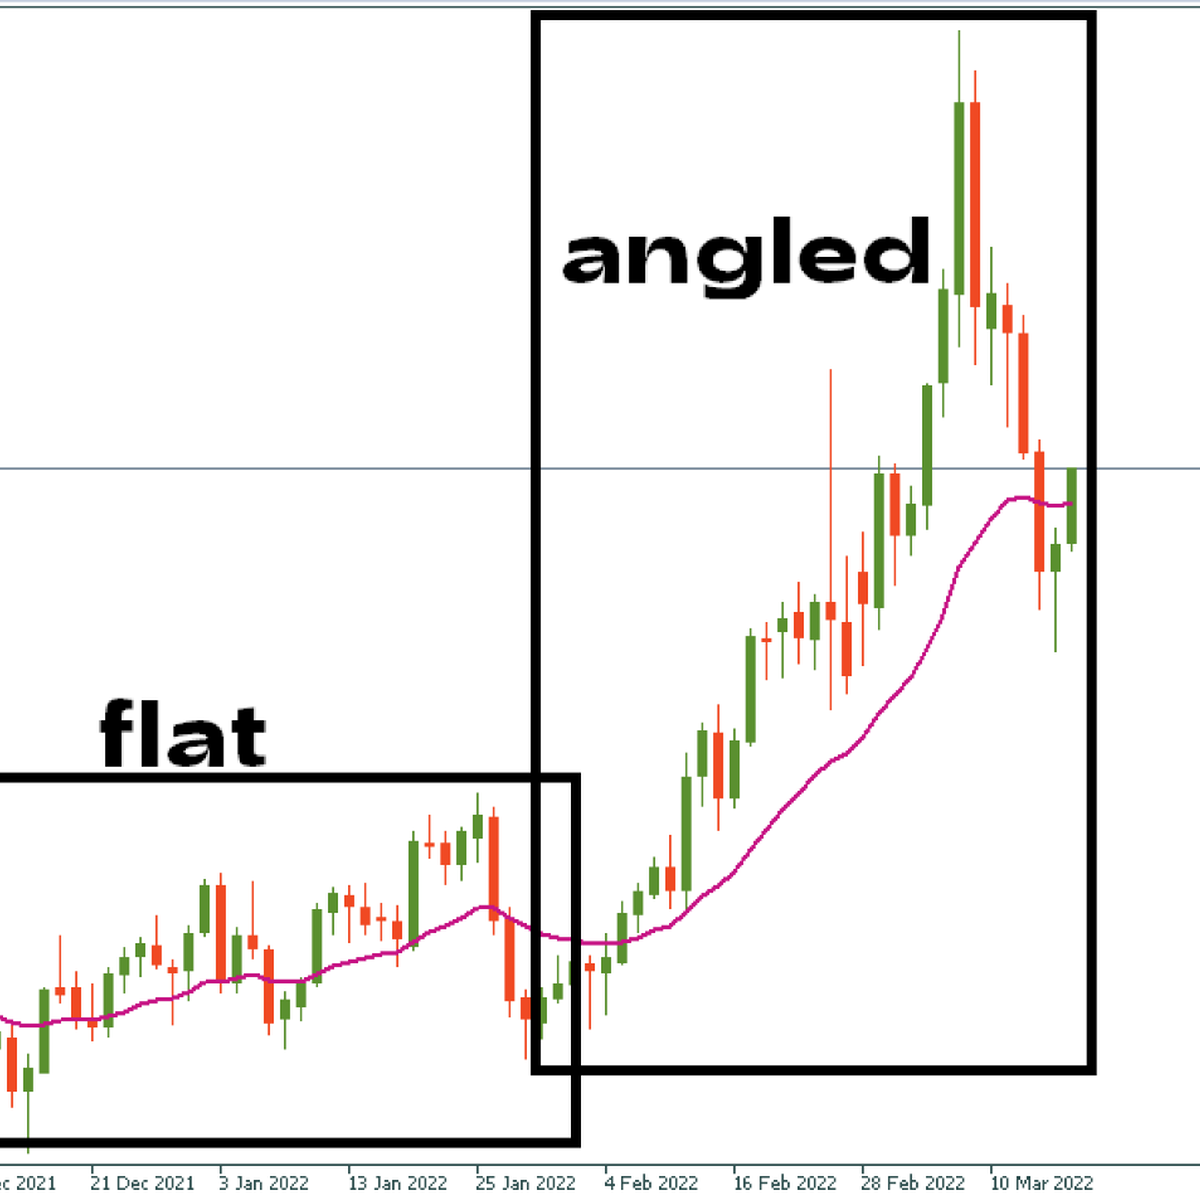
If moving averages are flat, they have a very strong gravitational pull. The price will have many problems trying to move away from the average. On the other hand, if moving averages are angled, then they have very little gravitational pull. The price will have time to move away from the average faster.
Once again, remember that moving averages turn into dynamic support and resistance levels. When the price returns to them, it can use these levels as a rough area to continue the trend (bounce up from support in an uptrend and turn down from resistance in a downtrend).
Remembering these tips, you can make your trading experience brighter. Try to pay attention to the details and don’t forget: practice makes perfect. So, use the moving averages in your daily trading and your technical analysis will bear fruit!

Bill Williams is the creator of some of the most popular market indicators: Awesome Oscillator, Fractals, Alligator, and Gator.

Trend strategies are good - they may give significantly good results in any time frame and with any assets. The main idea of the ADX Trend-Based strategy is to try to catch the beginning of the trend.

Counter-trend strategies are always the most dangerous but also the most profitable. We are pleased to present an excellent counter-trend strategy for working in any market and with any assets.


Your request is accepted.
We will call you at the time interval that you chose
Next callback request for this phone number will be available in 00:30:00
If you have an urgent issue please contact us via
Live chat
Internal error. Please try again later