

Williams’ Strategy
Bill Williams is the creator of some of the most popular market indicators: Awesome Oscillator, Fractals, Alligator, and Gator.

Don’t waste your time – keep track of how NFP affects the US dollar!
Data Collection Notice
We maintain a record of your data to run this website. By clicking the button, you agree to our Privacy Policy.

Beginner Forex Book
Your ultimate guide through the world of trading.

Check Your Inbox!
In our email, you will find the Forex 101 book. Just tap the button to get it!
Risk warning: ᏟᖴᎠs are complex instruments and come with a high risk of losing money rapidly due to leverage.
70.72% of retail investor accounts lose money when trading ᏟᖴᎠs with this provider.
You should consider whether you understand how ᏟᖴᎠs work and whether you can afford to take the high risk of losing your money.
Warning! Old version of the browser!
Press one of the icons below to proceed to the official website of the developer and download the latest version of your browser.

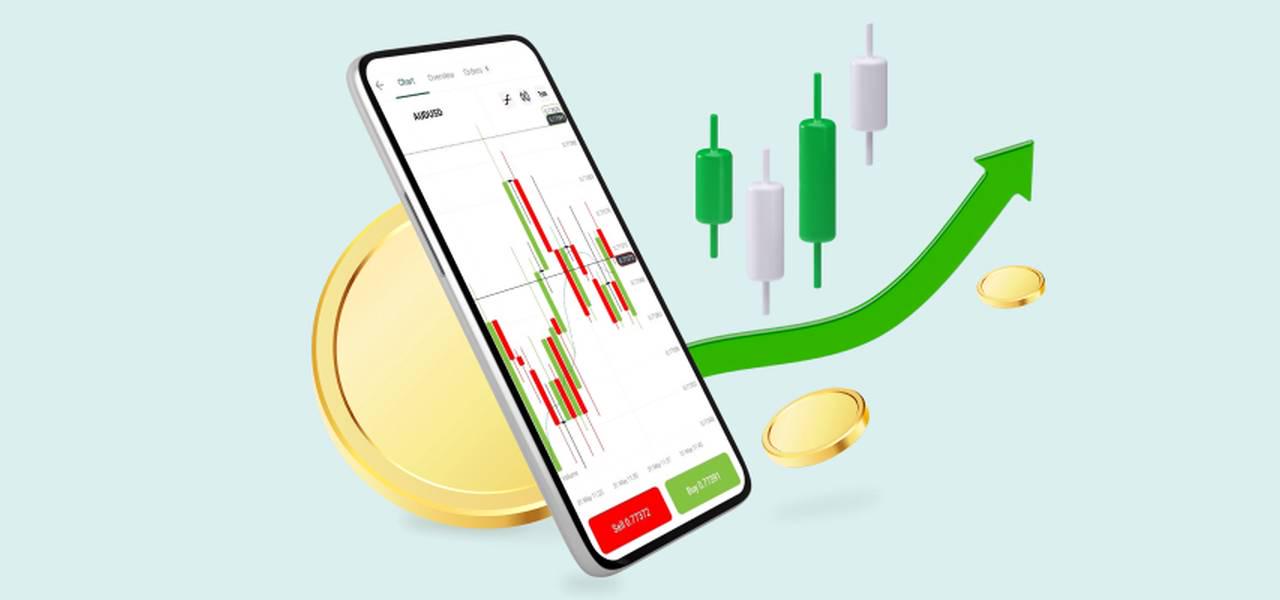
Online Forex broker
2022-08-26 • Updated
Information is not investment advice
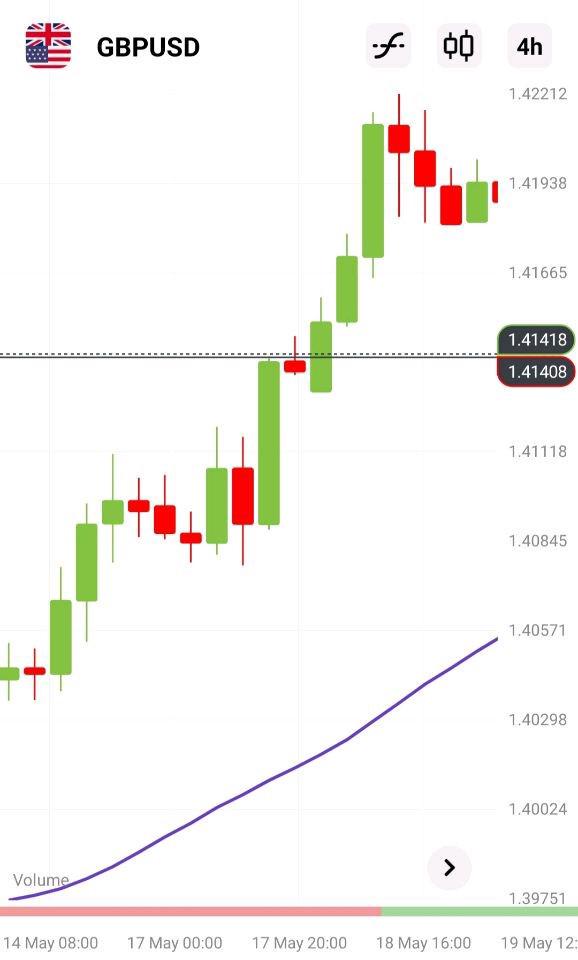
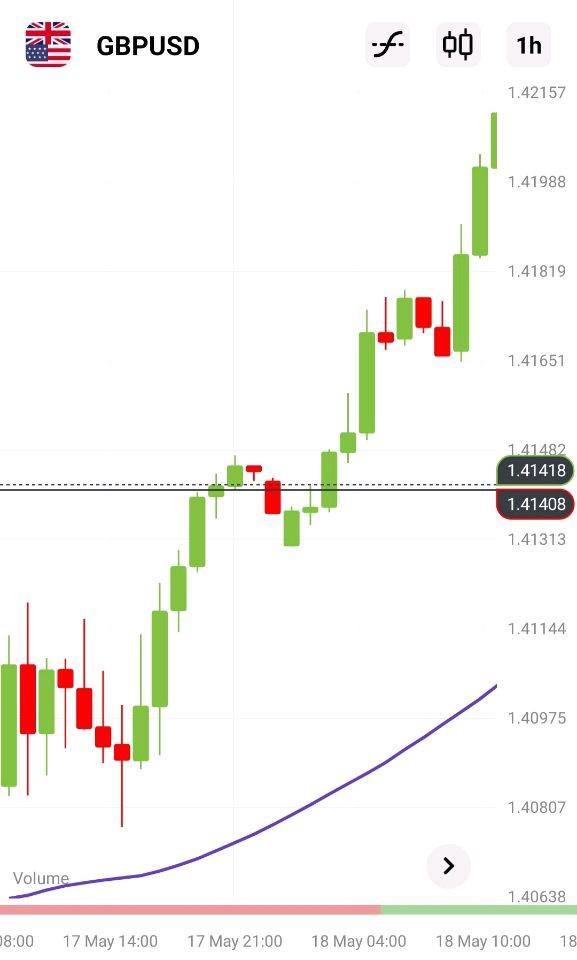
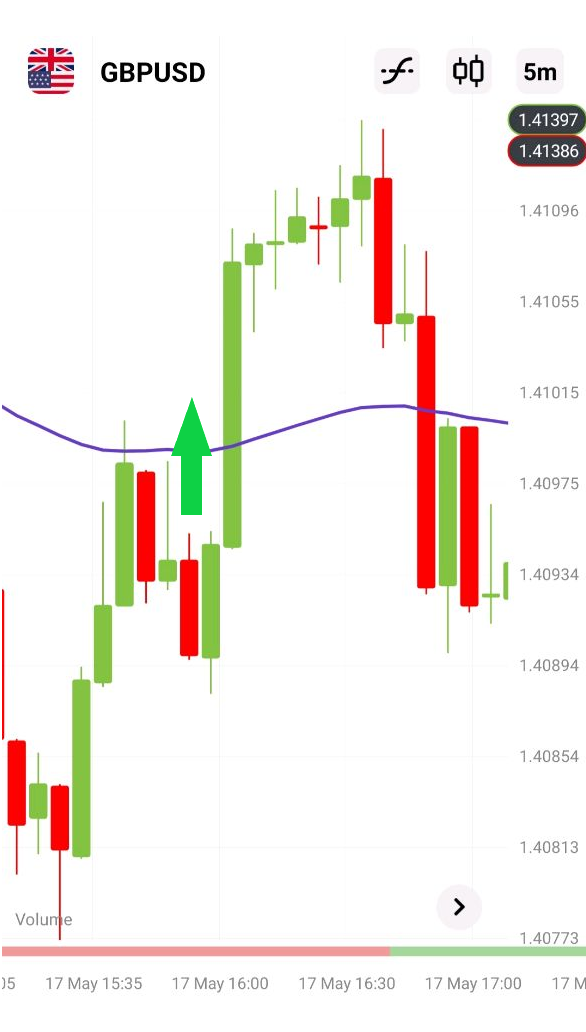
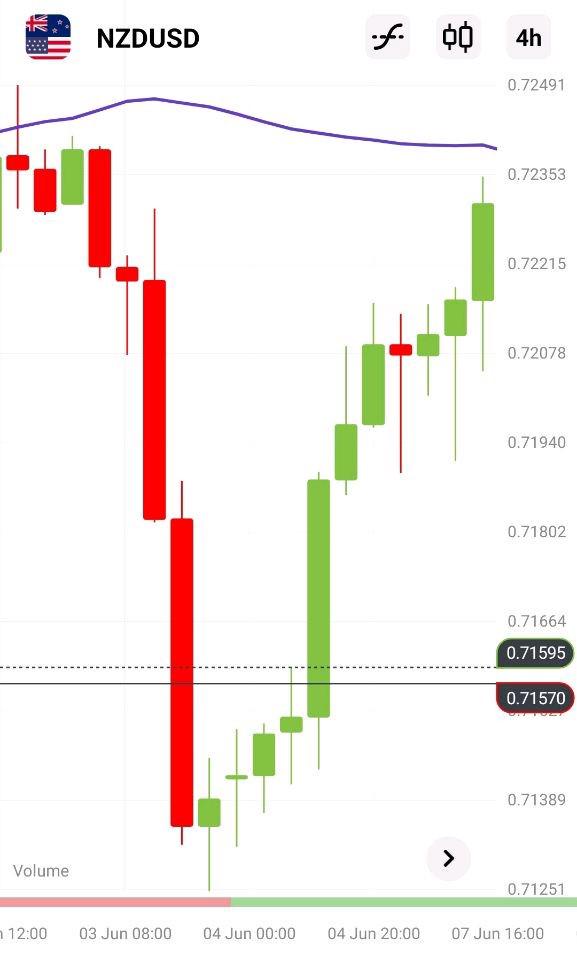
Technical indicators play a very important role: they calculate something and visualize it in the trading software thus saving a trader’s time. Moving Average is a classic indicator and one of the most helpful ones as well. In this article, we’ll see how a MA works and how to use it to improve trading results. Now Moving Average is available in FBS Trader App.
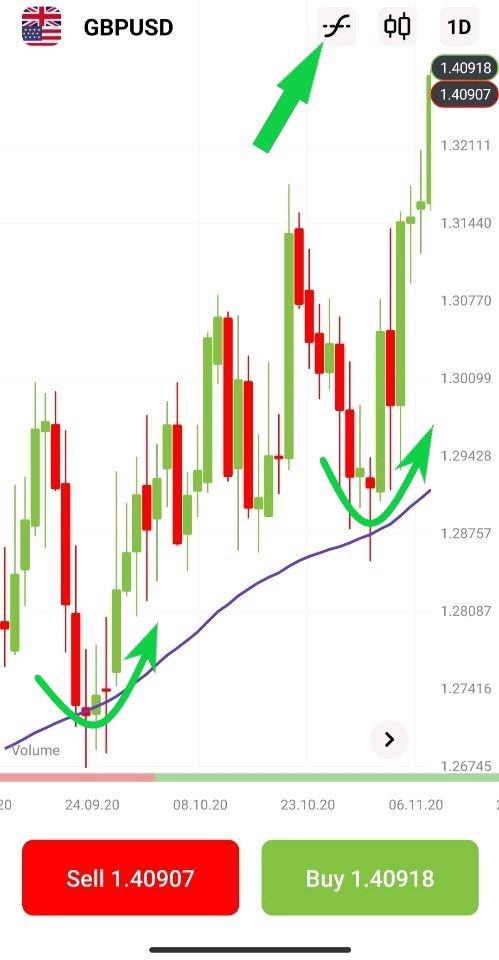
The essence of the indicator is in its name. First, a MA shows the average price for a period you choose. If you choose the ‘50’ period on a daily timeframe, the line will show you the average price for the last 50 days. As life goes on and new days arrive without a stop, the ‘last 50 days’ period is ‘moving' forward. New dots appear on the chart forming a line – 50-day Moving Average.
MA is an invaluable tool. There are two ways how will help you make competent trade decisions:
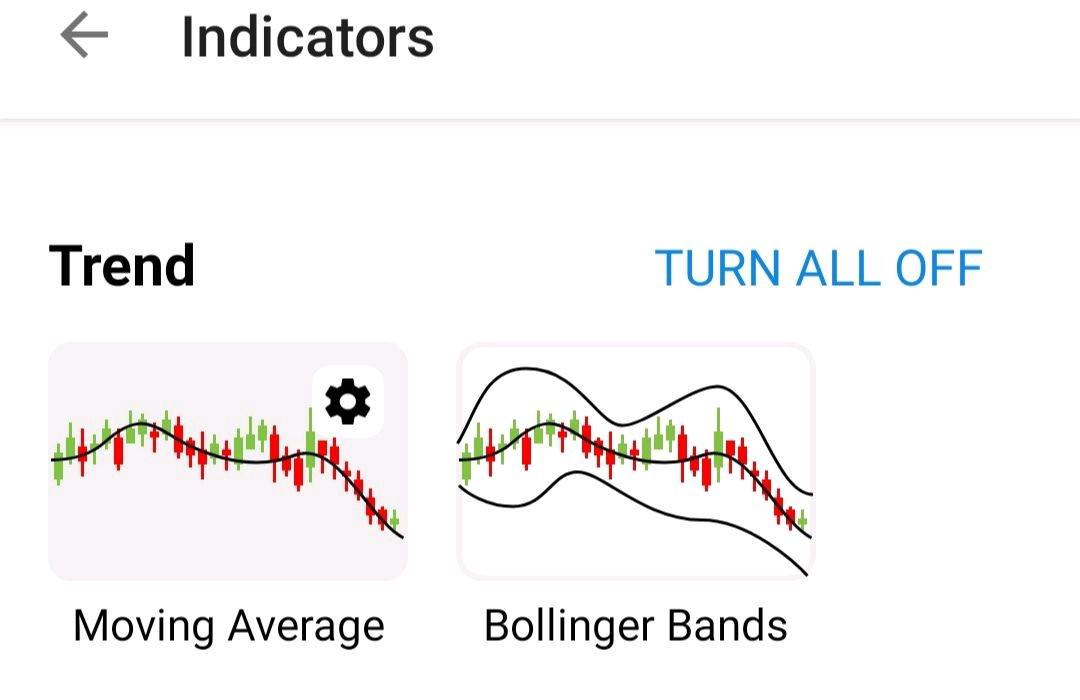
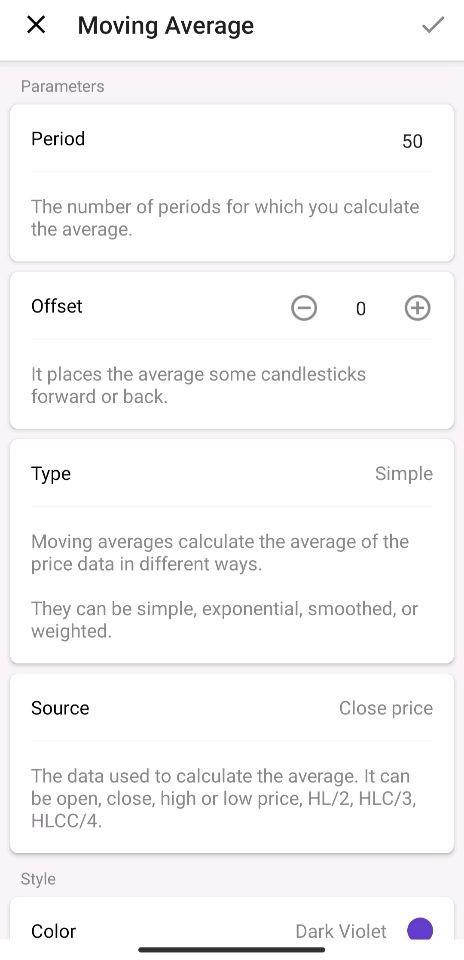
The indicator has two key parameters: type and period.
Type. If you want a classic line that shows the average price, choose Simple Moving Average (SMA) applied to close prices. If you want your MA to assign a bigger weight to the most recent prices (i.e. focus on the most recent price moves), choose an Exponential Moving Average (EMA). If your goal is to eliminate random moves of the price, which are not important and only distract us, choose smoothed MA. This type of MA is perfect for defining a trend.
Period. The smaller the period, the closer the MA will be to the price. A Moving Average with the period ‘1’ is literally the price itself. The bigger the period, the less the MA follows the particular moves of the price. We recommend you change periods of your MA to see how the line changes. For daily, weekly, and monthly timeframes, traders usually prefer such periods as 50, 100, and 200. For timeframes like H1 and lower, the popular MA periods are 9, 12, and 26.
Now the best part – strategies! Trading strategies provide you with the ready set of rules to enter and exit the market. You just need to follow the steps carefully. Remember that it's always better to test a strategy in a demo account first.

Bill Williams is the creator of some of the most popular market indicators: Awesome Oscillator, Fractals, Alligator, and Gator.

Trend strategies are good - they may give significantly good results in any time frame and with any assets. The main idea of the ADX Trend-Based strategy is to try to catch the beginning of the trend.

Counter-trend strategies are always the most dangerous but also the most profitable. We are pleased to present an excellent counter-trend strategy for working in any market and with any assets.


Your request is accepted.
We will call you at the time interval that you chose
Next callback request for this phone number will be available in 00:30:00
If you have an urgent issue please contact us via
Live chat
Internal error. Please try again later