

Williams’ Strategy
Bill Williams is the creator of some of the most popular market indicators: Awesome Oscillator, Fractals, Alligator, and Gator.

Don’t waste your time – keep track of how NFP affects the US dollar!
Data Collection Notice
We maintain a record of your data to run this website. By clicking the button, you agree to our Privacy Policy.

Beginner Forex Book
Your ultimate guide through the world of trading.

Check Your Inbox!
In our email, you will find the Forex 101 book. Just tap the button to get it!
Risk warning: ᏟᖴᎠs are complex instruments and come with a high risk of losing money rapidly due to leverage.
66.43% of retail investor accounts lose money when trading ᏟᖴᎠs with this provider.
You should consider whether you understand how ᏟᖴᎠs work and whether you can afford to take the high risk of losing your money.
Warning! Old version of the browser!
Press one of the icons below to proceed to the official website of the developer and download the latest version of your browser.

Online Forex broker
2022-08-26 • Updated
Information is not investment advice
Nowadays, every news resource is talking about inflation, economic articles are yelling about it. More and more people are getting confused with all the published information. On the Forex market, traders monitor this economic indicator regularly.
This article will help you figure out the basic information about inflation and everything related to it.
The inflation rate is one of the most important determinants of exchange rate developments, even if other elements are taken into account.
Simplistically, inflation is the general progressive increase in the prices of goods and services. When the prices go up, the number of goods that a person can buy for a certain amount of money decreases. For example, yesterday, you had $5, and you could buy five chocolate bars, but today, for $5, you can afford only three chocolate bars, so, in this case, inflation is high.
Not every type of inflation is catastrophic. They vary from the weakest to the strongest.
Creeping or mild inflation means that the prices rise by 3% or less per year. The Federal Reserve considers that when prices increase by 2% or less, it benefits economic growth. This is the way of organic economic expansion. That’s why the Fed sets 2% as a target inflation rate.
This is an intensive or destructive type of inflation, usually from 3% to 10%. People start to buy more than they need to avoid tomorrow's much-higher prices. It leads to the demand increase even further so that neither suppliers nor wages can keep up. Eventually, common goods and services become too pricy for most people.
When inflation rises to 10% and more, it brings disbenefit to country’s economy. At the same time, foreign investors avoid this country, thereby depriving it of needed capital. The economy becomes shaky, and government leaders’ credibility is lost. Galloping inflation must be prevented at all costs because otherwise it can precipitate an economic depression.
The galloping inflation is a more frequent economic phenomenon than hyperinflation and is periodically in evidence even in the most economically developed countries from time to time. For instance, galloping inflation was observed in the post-war years (1945-1952) and in the 1970s due to the increase in prices for oil set by OPEC.
In the 2000s, the number of countries experiencing galloping inflation significantly declined. The highest rate of such occasion was in Angola in 2004-2005 with the 23% rate.
Hyperinflation occurs when prices rocket by more than 50% per month. It is extremely rare. In fact, most examples of hyperinflation occur when governments print money to pay for wars. Examples of hyperinflation include Germany in the 1920s, Zimbabwe in the 2000s, and Venezuela in the 2010s. In the United States, hyperinflation occurred during the Civil War.
Deflation is a decrease in the general price level of goods and services. It is the process of prices falling, so it’s the opposite of inflation. Deflation leads to an increase in the buying power of a currency. In other words, you may have the same amount of money, but since prices are lower, your dollar will stretch further. The most obvious example of deflation is the US’s Great Depression.
Deflation is considerably damaging for GDP because people don’t buy goods as they wait for prices to decrease. That’s central banks oppose not only inflation, but deflation as well.
This differs from disinflation, which is only a slowdown in the rate of inflation (and the speed of that change is usually marked) in a nation's gross domestic product over time. Disinflation happens when the increase in the consumer price level slows down from the previous period when the prices were rising.
Stagflation is a combination of stagnation and inflation. It is the moment when there still is price inflation, but economic growth is stagnant. How can it be possible? If there isn't enough demand to stoke economic growth, why would prices go up?
This phenomenon occurred in the 1970s when the United States abandoned the gold standard. Once the value of the dollar was no longer pegged to gold, it plummeted. At the same time, gold prices skyrocketed. That time the Federal Reserve Chairman Paul Volcker finished stagflation by raising the fed funds rate to the double-digits. He kept it there long enough to dispel expectations of further inflation.
Wage inflation is an increase in nominal wages. It means workers receive higher pay. Of course, everyone thinks they deserve their own wage to be increased, but higher wages are one element of cost-push inflation. That can lead to the rising prices of a company's goods and services.
An underlying (or fundamental) rate of inflation measures the inflationary pressures in the economy that are predominantly due to market forces, i.e. changes in prices that reflect only the supply and demand conditions in the economy.
This type of inflation eventually will grow if there is not economic clack, supply shock, immerse price changes or other unpredictable disturbances.
The core inflation rate measures rising prices in everything except food and energy because their prices are extremely changeable due to the season. This exclusion makes the core rate more accurate than the headline inflation rate in measuring underlying inflation trends, that’s why central banks prefer using the core inflation rate when setting monetary policy. They use it as the main indicator to long-term inflation trends. Nevertheless, if fuel price has been increasing for a long time, it can affect core inflation by raising price expectations.
Core inflation is measured by both the Core Consumer Price Index (CPI) and the core personal consumption expenditures index (PCE). The CPI measures prices for household goods and services. The PCE represents the prices of goods and services purchased by consumers. So, if they are “core” that means except food and energy. Core PCE and CPI are like two brothers; they both help determine how much inflation is in the economy.
So, now when we can orient around all definitions of inflation, let’s see how we can measure and analyze it.
Inflation is measured by the inflation rate, the percent change in prices from one year to another. The inflation rate can be measured a few different ways:
The release of CPI (which you can check in the Economic Calendar) is highly popular among traders because there is a direct connection between inflation, central banks, and currency. Most developed countries try to hold the inflation rate at 2%.
When inflation is high, a central bank raises the interest rate. As a result, demand for currency grows, because a higher interest rate attracts foreign investors. Therefore, the exchange rate soars. And vice versa: when inflation is too low, central bank can decrease the interest rate, demand for currency will most likely be gone, so the exchange rate plummets.
That influences all currencies, but USD especially, because at the moment, the USA is struggling with 7.5% inflation.
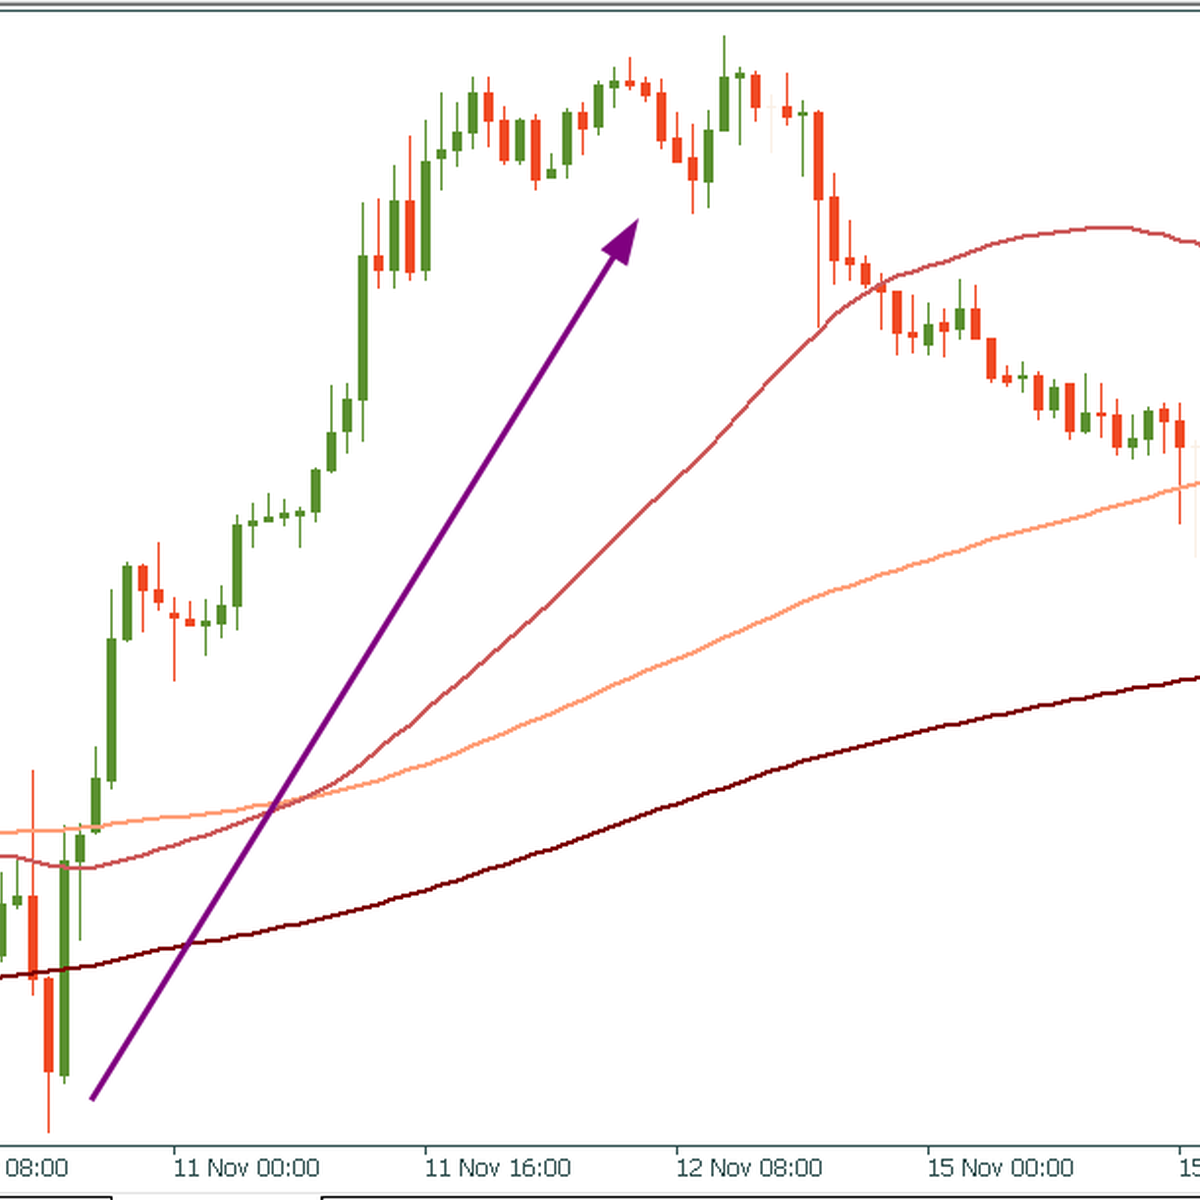
Let’s look at the example:
On November 10, 2021, the US Bureau of Labor Statistics release was one of the highest CPI rates of 0.9% in 2021. After the moment of publishing, USD strengthened against other currencies, for instance, USD/CAD went up by 2060 points:
When inflation is falling, traders will bet that the Federal Reserve will be considerate, helping to lift stock and bond prices. Conversely, if inflation is rising, traders will often believe that hard assets such as commodities will increase in value as the Fed looks to be less accommodative.
Traders regularly monitor whether the CPI that is released is stronger or weaker than expected. As there’s a moment of suspense, it’s a perfect opportunity to trade because, in any case, the result of the release provokes volatility which provides numerous opportunities for trading strategies.
To sum up, not every type of inflation is dreadful. Moreover, it’s a fantastic opportunity to trade on market changes at the CPI, PPI, and CPE release.

Bill Williams is the creator of some of the most popular market indicators: Awesome Oscillator, Fractals, Alligator, and Gator.

Trend strategies are good - they may give significantly good results in any time frame and with any assets. The main idea of the ADX Trend-Based strategy is to try to catch the beginning of the trend.

Counter-trend strategies are always the most dangerous but also the most profitable. We are pleased to present an excellent counter-trend strategy for working in any market and with any assets.


Your request is accepted.
We will call you at the time interval that you chose
Next callback request for this phone number will be available in 00:30:00
If you have an urgent issue please contact us via
Live chat
Internal error. Please try again later