Bill Williams is the creator of some of the most popular market indicators: Awesome Oscillator, Fractals, Alligator, and Gator.

Don’t waste your time – keep track of how NFP affects the US dollar!
Data Collection Notice
We maintain a record of your data to run this website. By clicking the button, you agree to our Privacy Policy.

Beginner Forex Book
Your ultimate guide through the world of trading.
Check Your Inbox!
In our email, you will find the Forex 101 book. Just tap the button to get it!
Risk warning: ᏟᖴᎠs are complex instruments and come with a high risk of losing money rapidly due to leverage.
68.53% of retail investor accounts lose money when trading ᏟᖴᎠs with this provider.
You should consider whether you understand how ᏟᖴᎠs work and whether you can afford to take the high risk of losing your money.
2023-01-17 • Updated
Information is not investment advice
A triangle chart pattern is a consolidation pattern that involves an asset price moving within a gradually narrowing range. Triangle patterns visualize the battle between buyers and sellers in the market. Despite this battle, triangle patterns generally signal the continuation of a previous trend, so traders tend to wait for the price to break out of the range to enter a trade.
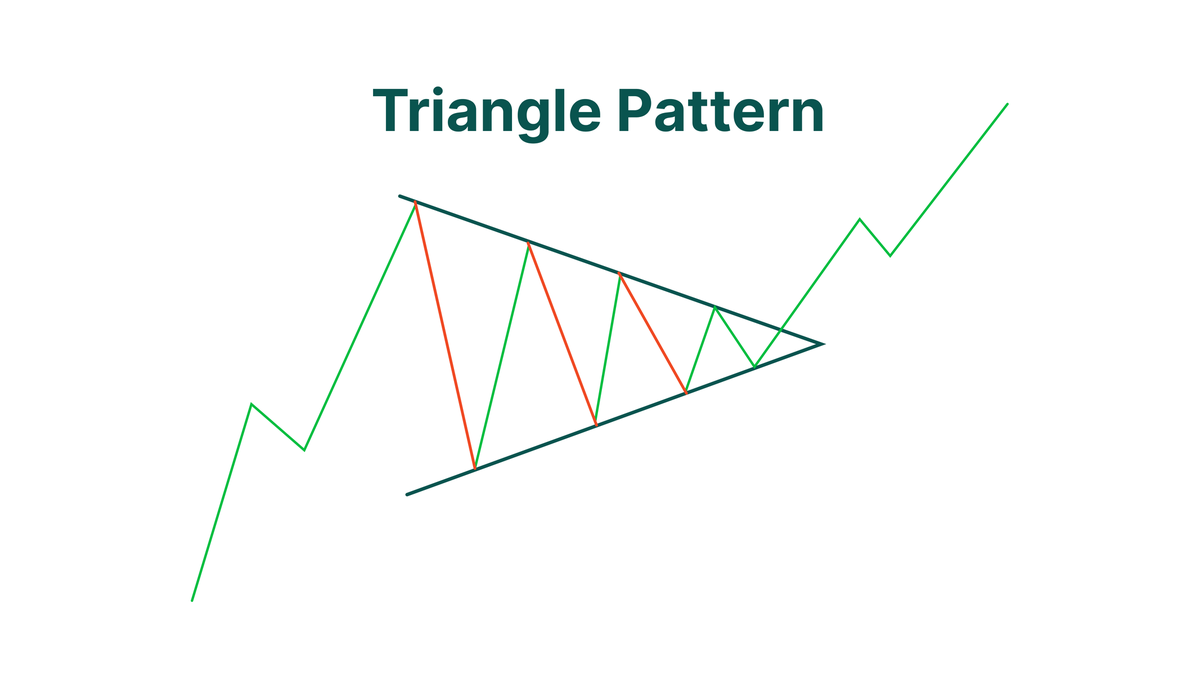
Triangle patterns can be identified on a chart by drawing two trend lines through the peaks and troughs of the formation. If the trend lines start far apart but later converge, the pattern you see is indeed a triangle chart pattern.
In this article, you will learn about the different types of triangle patterns, how to identify them on a chart, and what trading strategies you can use if you spot a triangle pattern on a chart.
The first type of triangle pattern we’ll discuss is a symmetrical triangle. Let’s take a look at the chart below.
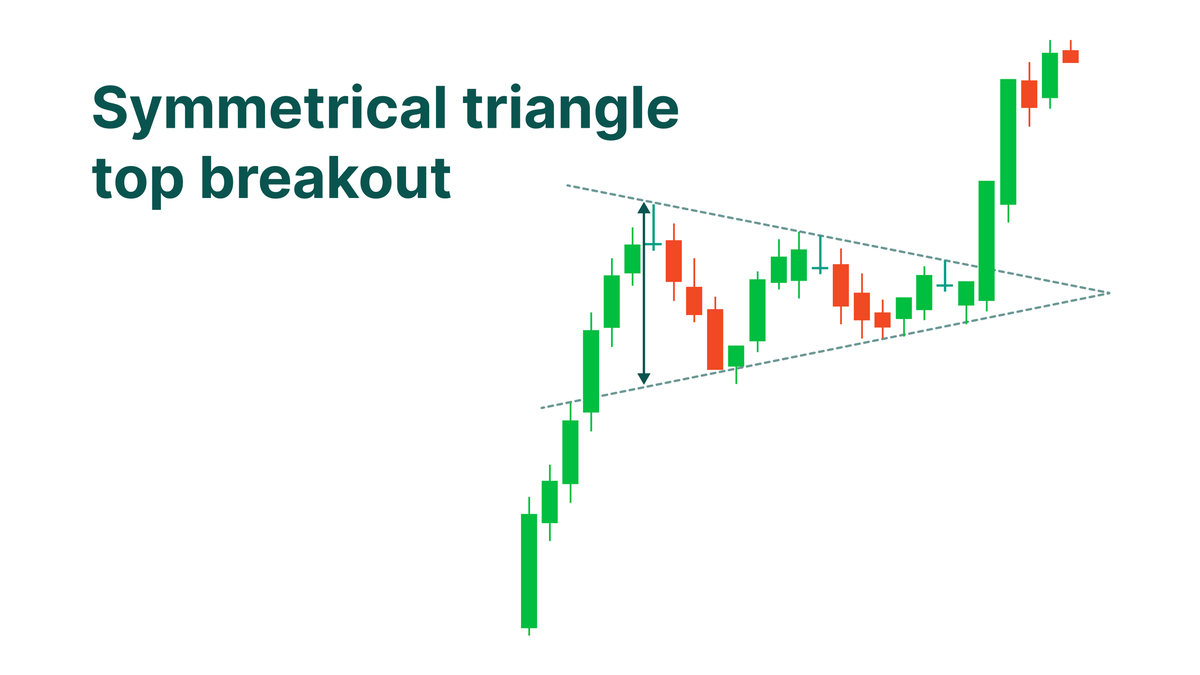
This is an example of a typical symmetrical triangle pattern. As you see, this pattern looks very prim and proper, with both trend lines coming together at a similar slope. This pattern is often used as a common example of triangle patterns because it forms a very clear and recognizable shape.
Symmetrical triangles occur when the price starts moving up and down within a limited range that gets smaller and smaller over time. The peaks of symmetrical triangles gradually become lower while the troughs keep climbing higher than the previous ones.
Symmetrical triangles usually occur in markets that don’t move in one direction. No single trend dominates this market, allowing buyers and sellers to influence price movements equally and create a period of consolidation.
Typically, when the price does break out from this limited range of movement, it moves in the direction of the previous trend with much more volume than during the formation of the pattern, showing that traders have moved away from the period of indecision and the trend is back on track.
The next type of triangle patterns we’re going to look at is an ascending triangle. Ascending triangles differ from symmetrical triangles in that only their bottom side is sloping. The upper side of an ascending triangle, drawn through the peak of the formation, remains horizontal, signaling that bear resistance stays the same despite the advance of the bulls.
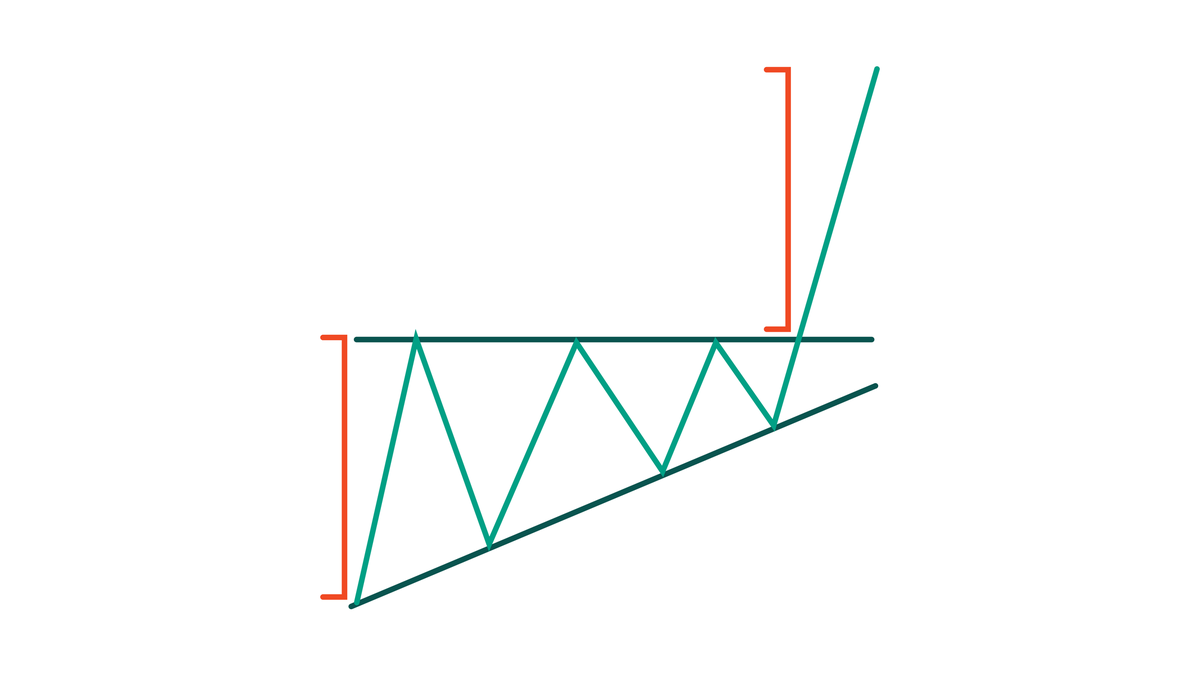
Typically, this pattern occurs after a very clear uptrend, which you can identify by the rising nature of its support line. It continues its climb and eventually converges with the static resistance line, breaking through it and resuming the previous uptrend. Thus, an ascending triangle is considered a bullish pattern that precedes a rise in price movement and trading volume.
Apart from identifying the future direction of price movement, ascending triangles can also indicate the best time to enter or exit trades, so spotting them on a chart means finding new opportunities for profitable trades.
A descending triangle is the complete opposite of an ascending triangle pattern. Descending triangles occur in a bearish market and, as you may have guessed, are considered bearish patterns.
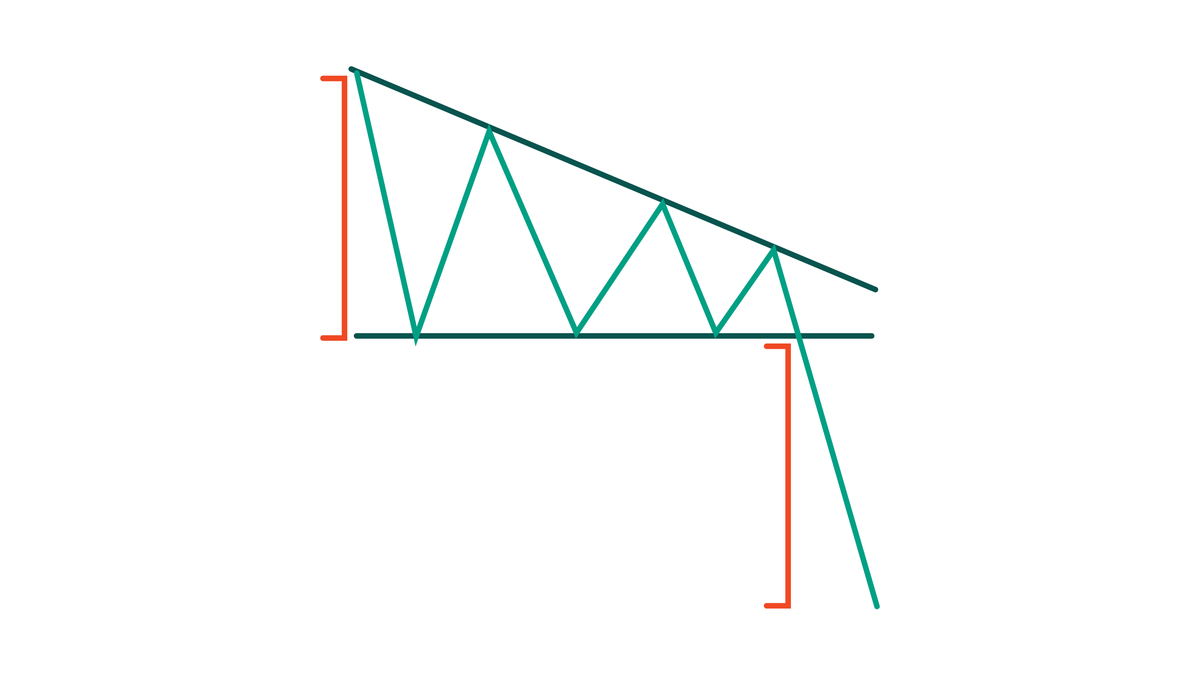
As you can see on this chart, a descending triangle mirrors its counterpart and has one sloping and one horizontal trend line. But with descending triangles, the sloping side is the resistance line. This pattern shows that it is the bears who keep advancing on the bulls, who, from their end, can’t seem to offer adequate support to counteract the impending resistance. In the end, the bears usually break the support line, signaling the end and confirmation of the triangle and the continuation of the previous downtrend.
Though both descending and ascending triangles usually signal the beginning of a downtrend and an uptrend respectively, it’s still possible for the price to bounce off the horizontal trend line, resulting in the reversal of a previous trend. So most of the time it’s better to wait until the pattern is complete before making any trading decisions.
If you spot a triangle pattern on your chart, the general advice is to wait until the price breaks out and forms a new trend. When it happens, you can enter a trade at the breakout point and move in the direction in which the price is moving. As for an exit point, once a triangle pattern is formed, the price usually moves by approximately the same distance as the height of the pattern, so you can plan your next move and get ready to take profits.
Nevertheless, when trading different triangle shapes, there are different things to consider, which we’ll talk about next.
As we already learned, symmetrical triangles can occur both in bullish and bearish markets. Both bulls and bears have equal positions, so the price can end up moving in either direction.
What you can do in this case is to place entry orders just above the resistance line and below the support line. This way, you will automatically enter the trade without worrying about the direction in which the market moves next. Or alternatively, you can wait for the breakout to see where the price ends up moving and then go with the flow.
Let’s look at the following example.
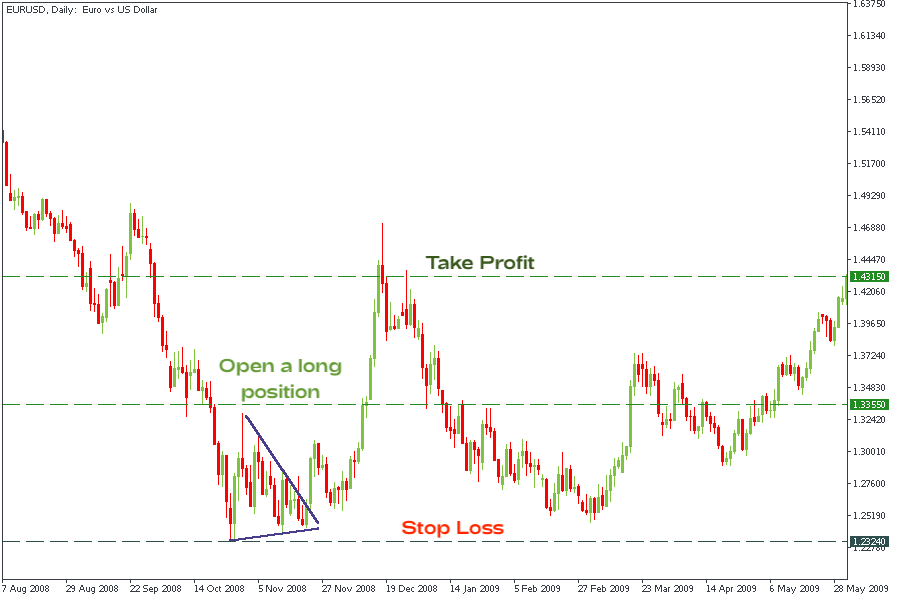
On the daily chart of EURUSD, you can observe a symmetrical triangle at the intersection of a rising trend line and a downward line within a large downtrend. After the pattern was identified, we waited for the breakout either to the downside or to the upside. In our example, the candlestick broke the resistance line, and, as a result, we entered the position at 1.3355. We placed a Stop Loss about 10 points below the lowest point of the triangle at 1.2324. As we already mentioned earlier, the movement of the price usually equals the height of the pattern. That’s why as our next move, we measured the distance between the highest and the lowest points of the pattern:
1.3294-1.2334=0.096.
Having measured that, we could now determine the best position to take out profits (1.3355 + 0.096 = 1.4315) and place an exit order.
Both ascending and descending triangles occur within bullish and bearish trends respectively and are usually considered continuation patterns, meaning that after the breakout, the market will continue moving in the same direction as before the pattern occurred.
However, this is not always the case. The price may bounce off one of the trend lines and reverse the trend altogether. Taking this into consideration, it’s obvious that the safest course of action while trading these patterns is to wait for a breakout and go with whatever direction the price moves next.
The following examples illustrate how you can trade ascending and descending triangles.
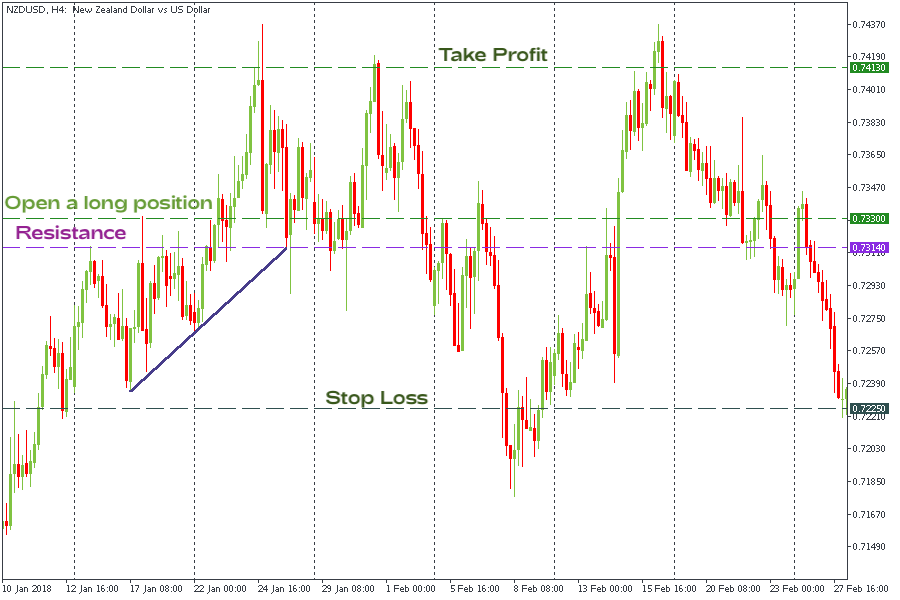
On the H4 chart of NZDUSD, you can see an ascending pattern formed between a horizontal resistance line at 0.7314 and a sloping support line. We decided to open the position after the break of the resistance at 0.7333. Then, we placed a Stop Loss at 0.7225 (10 points below the lowest point of the triangle) and took our profits at 0.7413 after identifying the height of the preceding triangle pattern (0.7314 − 0.7234 = 0.08).
Finally, let’s look at how to trade the descending triangle.
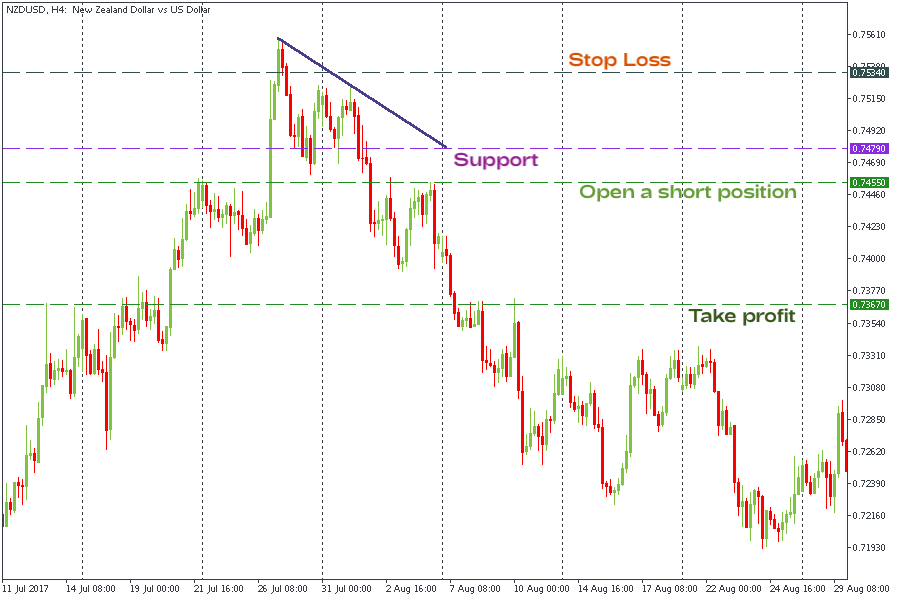
On the H4, the consolidation at the top of the upward trend shows that the bulls are unable to push the price higher. As a result, a descending triangle formed with the support line staying at 0.7470. We decided to enter the market at the breakout of the support, so we placed a short order at 0.7455. To minimize the risks, we then placed a Stop Loss 10 points above the last peak of the triangle at 0.7534 and put a Take Profit order at 0.7367.
The triangle pattern is one of the most common and recognizable chart patterns that is very likely to predict a continuation of the market movement direction. However, traders should remember that there is always a chance that a triangle pattern may end up reversing the previous trend, so it’s better to wait for the breakout before making any decisions.

Bill Williams is the creator of some of the most popular market indicators: Awesome Oscillator, Fractals, Alligator, and Gator.
Trend strategies are good - they may give significantly good results in any time frame and with any assets. The main idea of the ADX Trend-Based strategy is to try to catch the beginning of the trend.

Counter-trend strategies are always the most dangerous but also the most profitable. We are pleased to present an excellent counter-trend strategy for working in any market and with any assets.
Your request is accepted.
We will call you at the time interval that you chose
Next callback request for this phone number will be available in 00:30:00
If you have an urgent issue please contact us via
Live chat
Internal error. Please try again later