Patrones de Velas
Esta información no son consejos para inversión
Hay muchos patrones de velas diferentes. Cuando los traders reconocen estos patrones en el gráfico, actúan en consecuencia. Como resultado, la probabilidad de que una determinada acción del precio siga un patrón específico es alta.
Los traders examinan los patrones de velas a través de un análisis visual de los gráficos. También hay diferentes indicadores de reconocimiento de patrones para MetaTrader. Puedes encontrar éstas herramientas en Internet e instalarlas en tu software de trading. Aún así, incluso si un indicador o un asesor experto resalta los patrones en los gráficos para tí, necesitarás saber qué significa cada patrón.
Hay dos tipos principales de patrones de velas: patrones de reversión y patrones de continuación. Como lo evidencian estos nombres, muestran la probable dirección del mercado en relación con la acción del precio anterior.
Patrones de Reversión de Velas
Los patrones de reversión indican las altas probabilidades de que una tendencia cambie de dirección o haga una corrección profunda. Estos patrones ayudan a identificar posibles puntos de entrada al comienzo de una nueva tendencia o un gran movimiento en contra tendencia.
No todos los patrones de reversión tienen un peso similar. Es muy importante saber dónde tuvo lugar ese patrón y qué sucedió antes. La señal de reversión es fuerte en 2 casos:
- Cuando la tendencia anterior es fuerte y empinada.
- Si se produce un patrón de velas de reversión cerca de un fuerte nivel de soporte/resistencia.
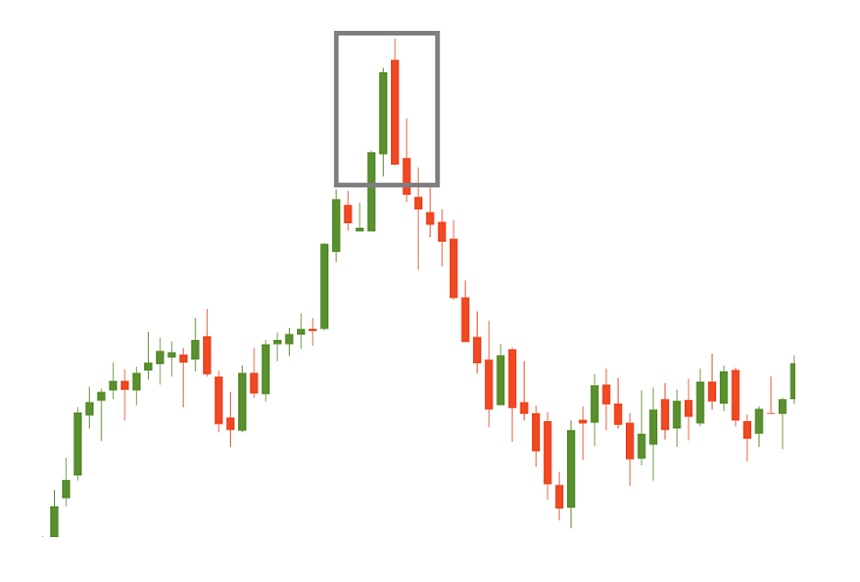
En la siguiente imagen, puedes ver un ejemplo de una fuerte señal de reversión: el patrón de velas de reversión formado después de una fuerte tendencia alcista.

Patrones de velas de continuación
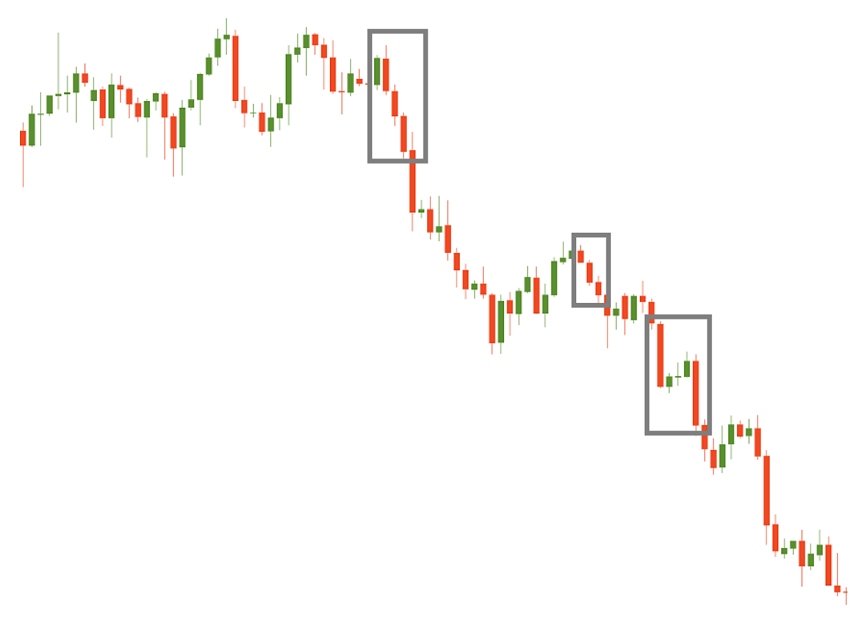
Los patrones de continuación sugieren que el mercado mantendrá la tendencia existente después de una pausa. Estos patrones ayudan a encontrar un nuevo punto de entrada en línea con una tendencia, así como también proporcionan evidencia para mantener las posiciones ya abiertas o aumentarlas.

Ten en cuenta que los patrones de reversión son más fáciles de reconocer que los de continuación. Como resultado, para los traders principiantes, recomendamos comenzar a aprender los patrones de reversión. También es posible dividir los patrones de velas en alcistas y bajistas. En la mayoría de los casos, representan las imágenes especulares entre sí. En los siguientes tutoriales, explicaremos los patrones de velas de reversión y continuación más populares.


