


How to Use Fibonacci Retracements
Information is not investment advice
What are Fibonacci retracement levels?
In trading relying on intuition alone isn’t enough. To reach success, traders need to be able to use various techniques and tools to predict the movement of asset prices. One of such tools is Fibonacci retracement levels. Fibonacci retracement levels are horizontal lines on a price chart that show potential support and resistance levels in price movement. This helps traders see at which point the price may return back to a previous level before continuing on with the trend.
In this article you will learn more about Fibonacci retracements, how to calculate and apply them in your trading, what other tools are compatible with Fibonacci retracements and what limitations you may encounter while using this tool.
Formula for Fibonacci retracement levels
Fibonacci retracement tool is based on math. To identify Fibonacci retracement levels, you need to apply the following formula:
UR = H - ((H - L) * percentage) – for uptrend movement; or
DR = L + ((H - L) * percentage) – for downtrend movement,
where
- UR is the uptrend retracement;
- DR is the downtrend retracement;
- H is the high price;
- L is the low price.
Although most trading platforms can make these calculations automatically, but it’s still good to understand how you can do this on your own.
How to calculate Fibonacci retracement levels
Now that you know the formula for Fibonacci retracement levels, you can learn how to actually calculate them.
Firstly, you need to look at a price chart and choose two price points – one high price point and one low price point. It’s very important to make sure that there are no higher highs or lower lows. If you identify them mistakenly, your calculations will be wrong and you’ll miss the right retracements levels. Then, once you’ve found the high and the low, you can use these two numbers in the formula and calculate retracement levels for this particular price movement sector.
What are the Fibonacci ratios?
However, knowing only the high and the low is not enough. You also need to know what percentage to use in the formula. When calculating Fibonacci retracement levels, traders use so-called Fibonacci ratios.
The Fibonacci ratios are percentages of a chosen price range that determine the support and resistance levels of a price movement. The Fibonacci ratios were derived from the Fibonacci numbers – a sequence of numbers where each number is the sum of the previous two. If you divide a Fibonacci number by the next number, the result will be 0.618 (61.8%). If you divide the same number by the second number to its right, you’ll get 0.382 (38.2%), and then 0.236 (23.6%). It turns out that these ratios along with 50% represent the support and resistance levels in price movements, so they’re used to identify the Fibonacci retracement levels.
For example, let’s say an asset’s price increased from $15 to $18.43. In this case, the formula to find the Fibonacci retracement levels would look like this:
$18.43 - (($18.43 - $15) * percentage)
As a result, we’ll get the following retracement levels: $17.62 (at 23.6%), $17.12 (at 38.2%), $16.71 (at 50%) and $16.31 (at 61.8%).
How do you apply Fibonacci retracement levels in a chart?
Fibonacci retracement levels can be used in charts as a way to find the most opportune moment to enter a trade. The most common way to apply this tool is to see whether the price retraces to one of the Fibonacci levels after following a steady trade. For example, if you see that after a significant increase the asset price declines 23.6% and then goes back up, it might be a good time to enter the trade.
How do you draw a Fibonacci retracement?
Despite their unexplainable nature, Fibonacci retracement levels are considered a reliable tool for price movement prediction, especially coupled with other technical analysis methods. However, drawing a Fibonacci retracement line may seem quite challenging to some traders because a poorly drawn line can lead to wrong conclusions and mess up your whole trade. That’s why it’s important to know how to draw Fibonacci retracements properly.
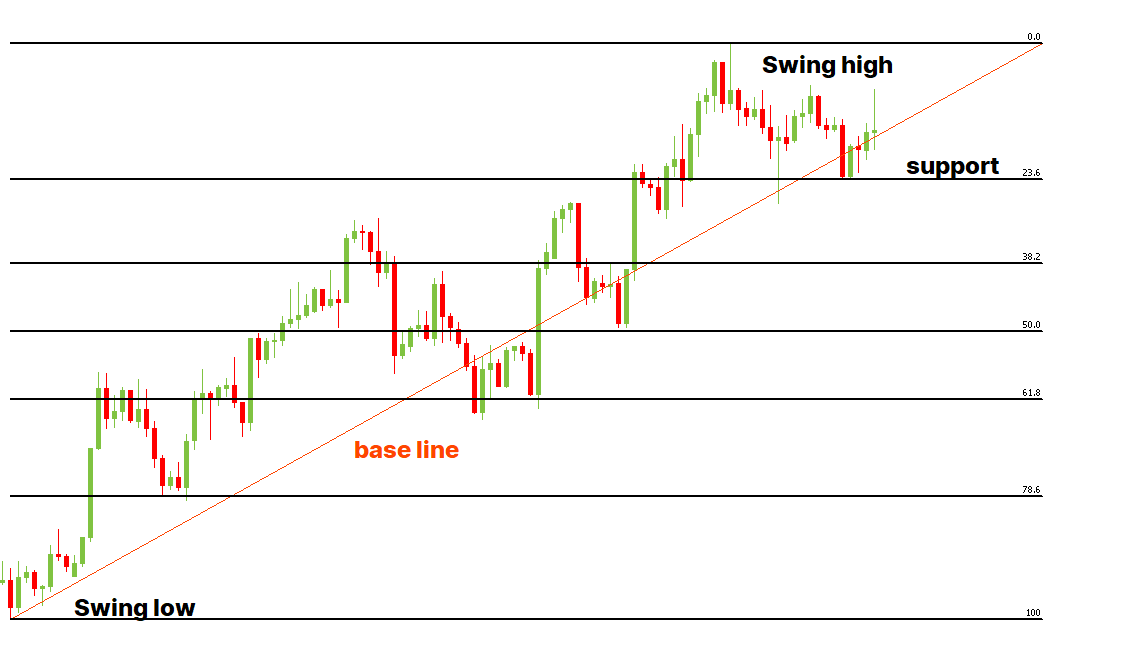
Luckily, most trading platforms have the Fibonacci tool built in them, so you don’t actually need to draw the line and the levels manually. But what you do need to do is carefully examine the most recent price movement and choose the swing high and the swing low points. Then you need to drag your cursor from the low point to the high point (for an uptrend) or from the high point to the low point (for the downtrend) to draw the so-called base line. After this, the software will automatically place the Fibonacci levels, allowing you to see the potential support or resistance levels on your chart and build your trading strategy accordingly.
How to trade using Fibonacci retracement
There are multiple ways to incorporate Fibonacci retracement levels in your trading strategy.
Asset prices don’t move in a straight line. There might be some retracements within a trend, after which the price returns back on track. In this case, Fibonacci retracement levels can show you when the price is likely to encounter support and resistance and continue moving with the general trend. You can use this information to find the most suitable time to enter a trade and even set up automatic entry points at the retracement levels.
It doesn’t matter if you are trading with or against the trend; use Fibonacci retracement to find a place where an asset may bounce or reverse. Also, these lines are helpful in placing a Stop Loss and a Take Profit.
Generally, traders prefer to be on the safe side and enter the trade when the price has already bounced from one of the Fibonacci levels. But some traders choose an aggressive style of trading and don’t wait for the price to bounce off before entering a trade. In this case, Fibonacci retracement levels can also be used to place a Stop Loss order as a safety measure.
Placing Stop Loss and Take Profit
Usually, traders place a Stop Loss order just below the next Fibonacci level after they buy an asset or above the next level after they sell one. This way, if the trend gets reversed, your losses are minimized.
Take profit order is slightly different because some traders prefer to close part of the trade at the closest resistance line and move the Stop Loss to breakeven. When trading with Fibonacci retracement, consider splitting your order into 2-4 equal parts and close one piece each time the price touches one of the Fibonacci levels. You may close the last part at the 0.0 level to book your profit completely.
Fibonacci retracement with other tools
Since Fibonacci retracements are used to identify potential support and resistance levels, it’s better to use other tools and methods before deciding on your next move. Here are the other tools that can be used with Fibonacci retracements:
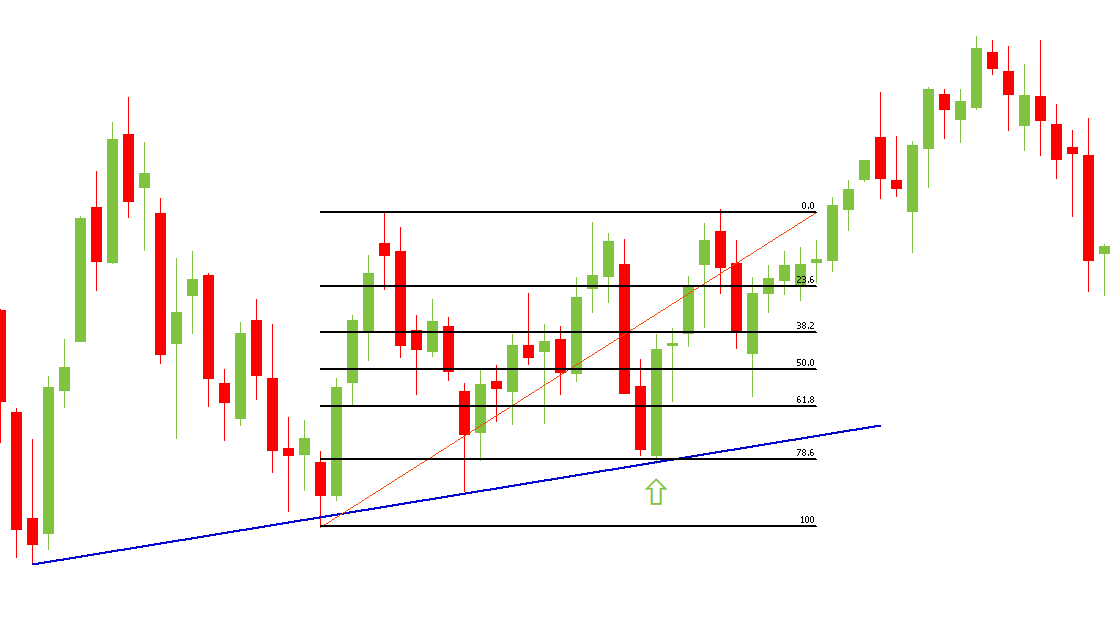
- Trend lines. If you draw a trend line along the price movement trajectory and use the Fibonacci retracements at the same time, you will see the trend line cross the retracements levels. The places where it happens are considered the most favorable points to enter the trade.
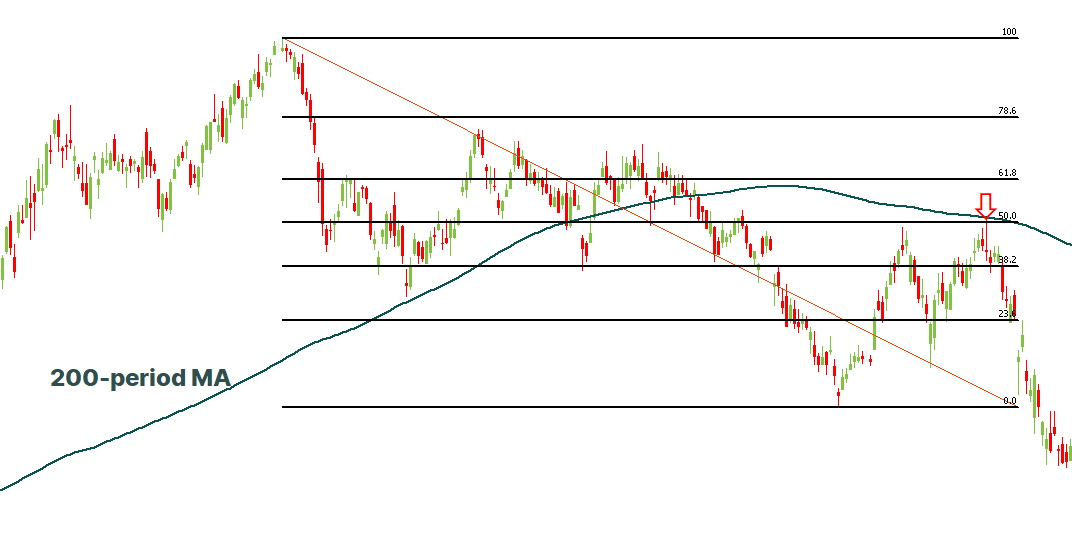
- Moving averages. Moving averages are useful for identifying potential support and resistance areas. The 200-period moving average in particular is often used together with Fibonacci retracements because if it coincides with the 50% retracement level, there’s very likely going to be a pullback on this level. This point is a great place to enter the market or take the profits.
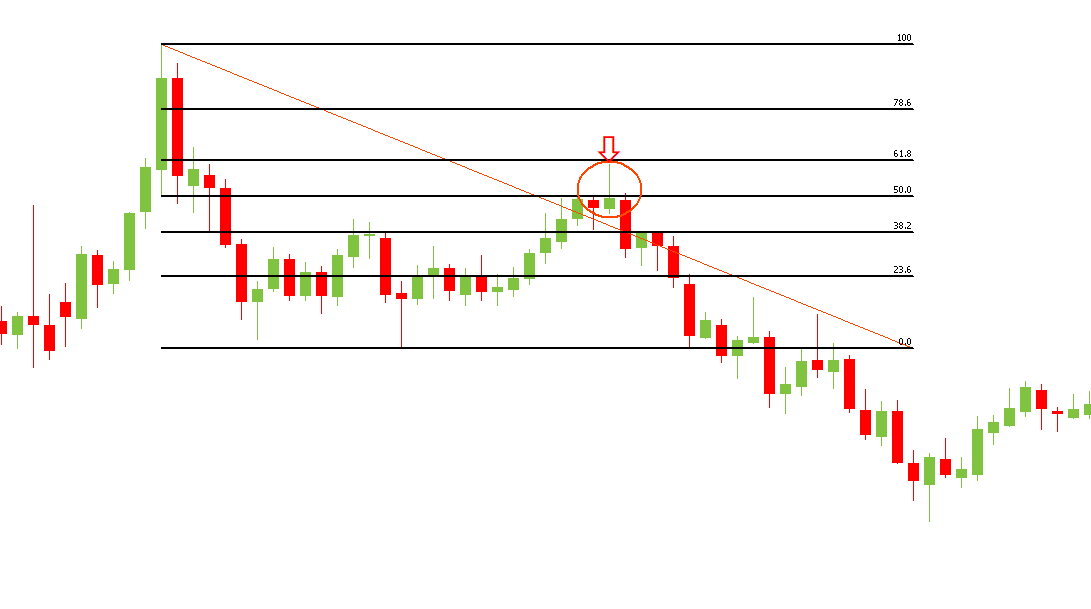
- Candlestick patterns. Looking for reversal candlestick pattern near the retracement levels is a good way to make sure that support or resistance is likely to occur. So knowing your way around candlesticks can help you understand the Fibonacci retracement levels more. Notice that candlestick patterns are unreliable when used without other technical indicators and can provide lots of false signals. Try to use them with Fibonacci retracement, RSI oscillator, or volume analysis.
Limitations of using Fibonacci retracement levels
Even though the Fibonacci retracement levels are a popular tool to identify potential support and resistance levels, there’s no guarantee that the price will bounce from these levels. It’s just as possible for the trend to keep on going in the direction that is opposite to the current trend and never stop at any of the Fibonacci levels, signaling the reversal in price movement.
Another issue is that it’s impossible to predict at what level exactly the price is going to reverse. So using Fibonacci retracements alone without other tools or confirmation signals (like price bounce-off) won’t give a concrete estimation as to whether and when the price is going to continue with the trend.
RSI oscillator works incredibly well combined with Fibonacci retracement. Together they provide more reliable signals for entering and exiting a trade.
The bottom line
Fibonacci retracement may be one of the best tools you can use in trading because it can show where a trader should buy or sell. It shows the best times to enter or exit the trade and where to put a stop-loss order. The best thing about Fibonacci retracement is that it allows a trader to look into the future and forecast possible support and resistance levels before the price reaches them. Though very popular with traders, Fibonacci retracement is still not an infallible tool, so combining it with other tools and methods is essential to get the best prediction possible.

Other articles in this section
- Reversal candlestick patterns
- Continuation candlestick patterns
- Gator Oscillator
- Awesome Oscillator
- Ranges
- Alligator indicator
- Bill Williams theory
- Fractals
- Chart patterns
- Uncovering Gann indicators
- Candlestick patterns
- Trend trading
- Carry trade
- Swing trading
- Position trading
- Day trading
- Scalping
- Trading styles
- Trader's psychology
- Japanese Candlesticks
- Trends
- Market conditions and phases
Choose your payment system


