


Reversal candlestick patterns
Information is not investment advice
Below you can find the schemes and explanations of the most common reversal candlestick patterns.
Bullish patterns
Bullish reversal patterns appear at the end of a downtrend and signal the price reversal to the upside.
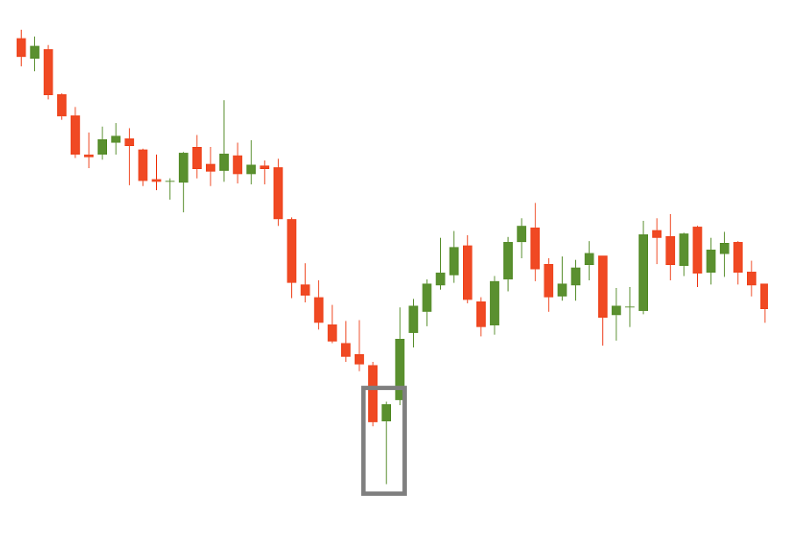
Hammer
A 1-candle pattern. It can signal an end of the bearish trend, a bottom or a support level. The candle has a long lower shadow, which should be at least twice the length of the real body. The color of the hammer doesn’t matter, though if it’s bullish, the signal is stronger.
Hammers occur frequently and are easy to recognize. They show that although bears were able to pull the price to a new low, they failed to hold there and by the end of a trading period lost a battle with buyers. The signal is stronger if a hammer forms after a long decline in the price.
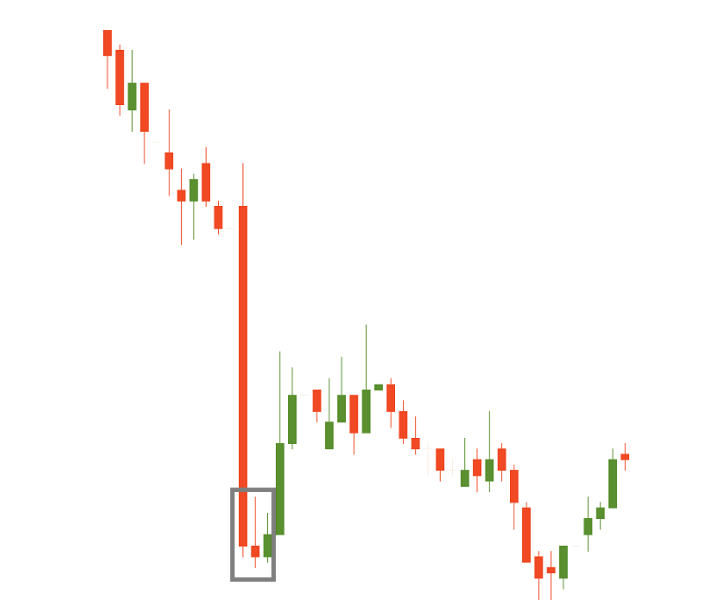
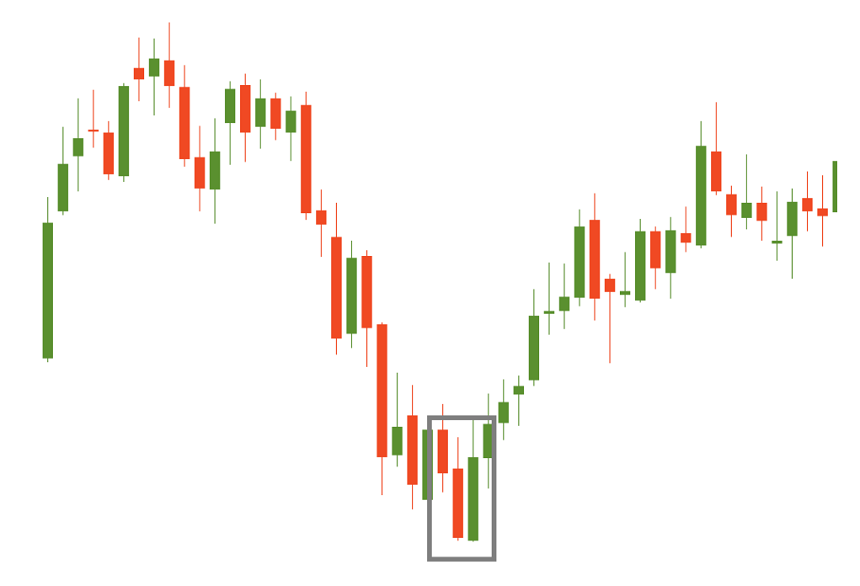
Moreover, the buy signal will be more reliable if a hammer is followed by a candlestick that closes above the opening price of the candlestick on its left. Here’s how a hammer looks at the real chart:
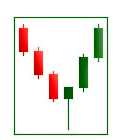
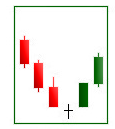
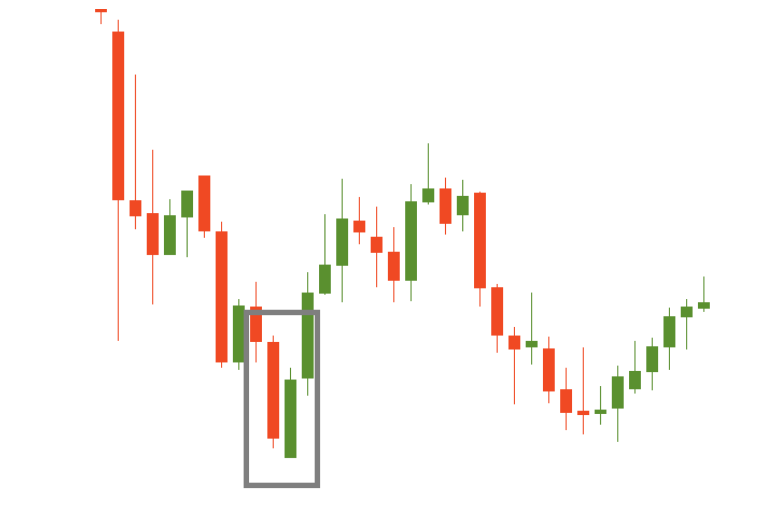
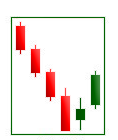
Morning star
A 3-candle pattern. After a long bearish candle, there’s a bearish gap down. The bears are in control, but they don’t achieve much. The second candle is quite small and its color is not important, although it’s better if it’s bullish. The third bullish candle opens with a gap up and fills the previous bearish gap. This candle is often longer than the first one.
The gaps are not an absolute must for this pattern but the reversal signal will be stronger if they are present.
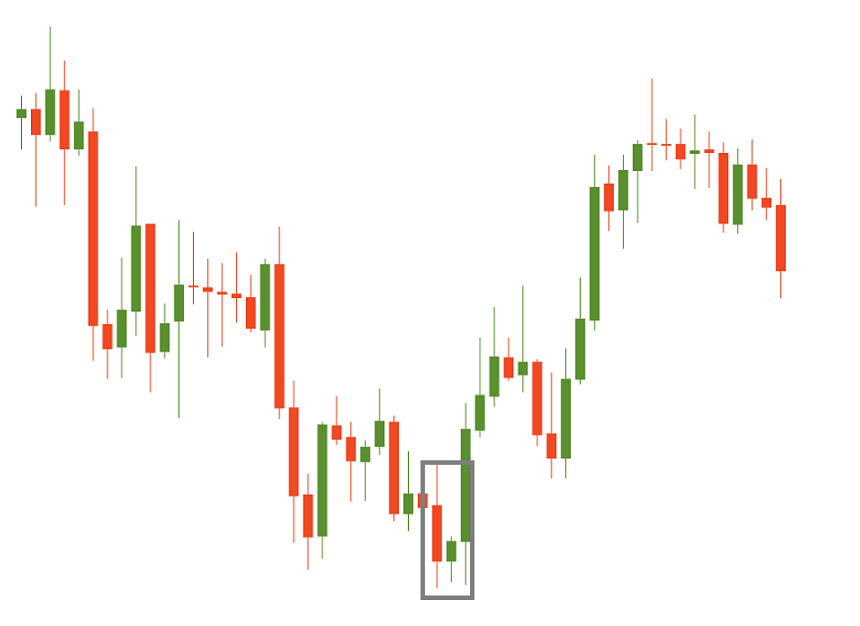
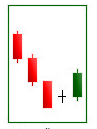
Morning doji star
A 3-candle pattern. Almost the same as previous, but the second candlestick is a doji.
The signal of this pattern is considered stronger than a signal from a simple “morning star” pattern.
Inverted hammer
A 1-candle pattern. The candle has a small body and a long upper shadow, which is at least in 2 times longer than the real body.
The color of the hammer doesn’t matter, though if it’s bullish, the signal is stronger. An inverted hammer always requires further bullish confirmation.
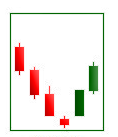
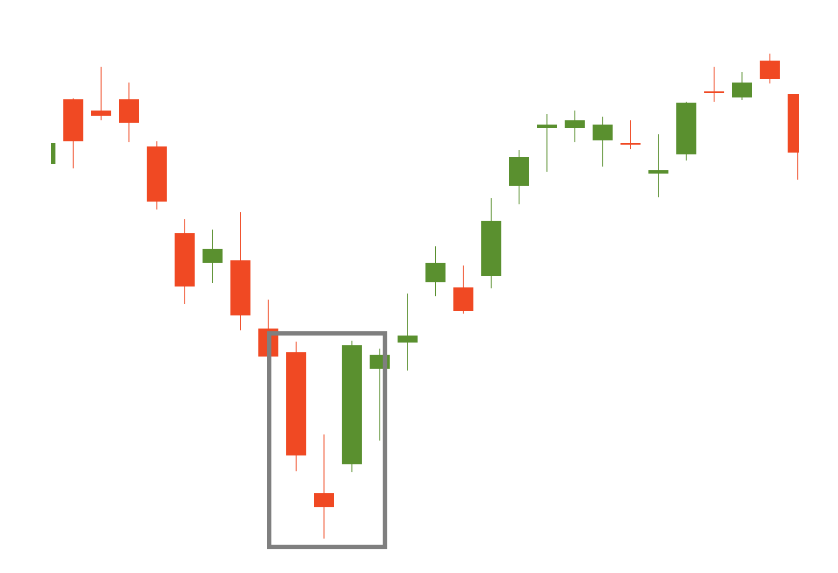
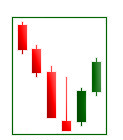
Piercing line
A 2-candle pattern. The first candlestick is long and bearish. The second candlestick opens with a gap down, below the closing level of the first one. It’s a big bullish candlestick, which closes above the 50% of the first candle’s body. Both bodies should be long enough.
The pattern shows that even though trading started with a bearish impulse, buyers managed to reverse the situation and seal their gains. The signal is moderately strong.
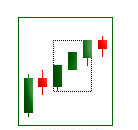
Bullish harami
A 2-candle pattern. The body of the second candle is completely contained within the body of the first one and has the opposite color.
Notice that a harami pattern always requires confirmation: the following candlestick should be big and bullish.
Bullish harami cross
A 2-candle pattern is similar to the Harami. The difference is that the last day is a doji.
You can see that this pattern looks very much like the “morning doji star” pattern. The logic and the implications are similar.
Bullish engulfing pattern
A 2-candle pattern appears at the end of the downtrend. The first candlestick is bearish. The second candle should open below the low of the first candlestick low and close above its high.
This pattern produces a strong reversal signal as the bullish price action completely engulfs the bearish one. The bigger the difference in the size of the two candlesticks, the stronger the buy signal.
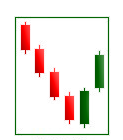
Three white soldiers
A 3-candle pattern. There’s a series of 3 bullish candles with long bodies. Each candle should open within the previous body, better above its middle. Each candle closes at a new high, near its maximum.
The reliability of this pattern is very high, but still, a confirmation in the form of a white candlestick with a higher close or a gap-up is suggested.
Bearish reversal patterns
Bearish reversal patterns appear at the end of an uptrend and mean that the price will likely turn down.
Shooting star
A 1-candle pattern. The candle’s body is small. The upper shadow is long and exceeds the body in at least 2 times.
The long upper shadow implies that the market tried to find where resistance and supply were located, but the upside was rejected by bears. The candle may be any color, though if it’s bearish, the signal is stronger.
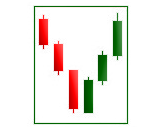
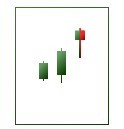
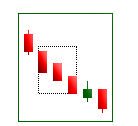
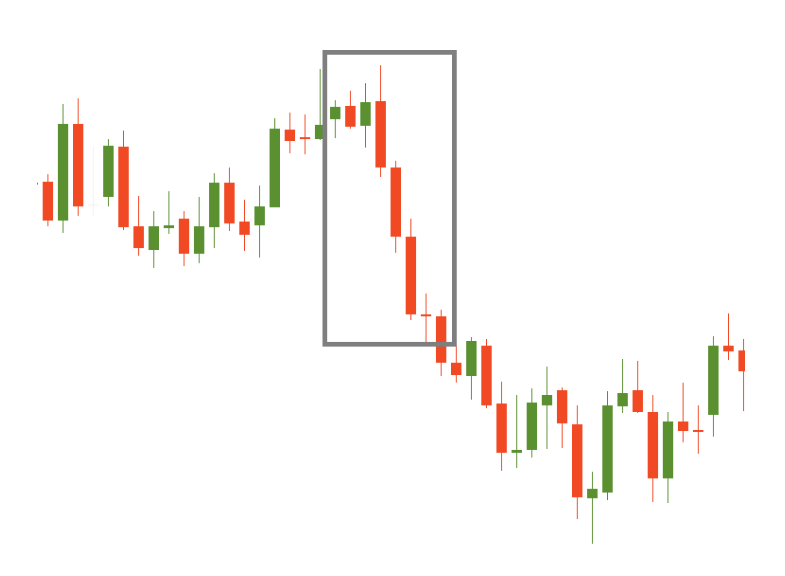
Evening star
A 3-candle pattern. After a long bullish candlestick, there’s a bullish gap up. The bulls are in control, but they don’t achieve much. The second candlestick is quite small and its color is not important. The third bearish candle opens with a gap down and fills the previous bullish gap. This candle is often longer than the first one.
It’s better when this pattern has gaps, but that is not a necessary condition.
Evening doji star
A 3-candlestick pattern. The pattern is similar to the “evening star”, but is considered to be a stronger signal as the middle candle is doji.
The signal of this pattern is considered stronger than a signal from a simple evening star pattern.
Hanging man
A 1-candlestick pattern. It can signal an end of the bullish trend, a top or a resistance level. The candle has a long lower shadow, which should be at least twice the length of the real body. The candle may be any color, though if it’s bearish, the signal is stronger.
The pattern requires further bearish confirmation. The sell signal is confirmed when a bearish candlestick closes below the open of the candlestick on the left side of this pattern.
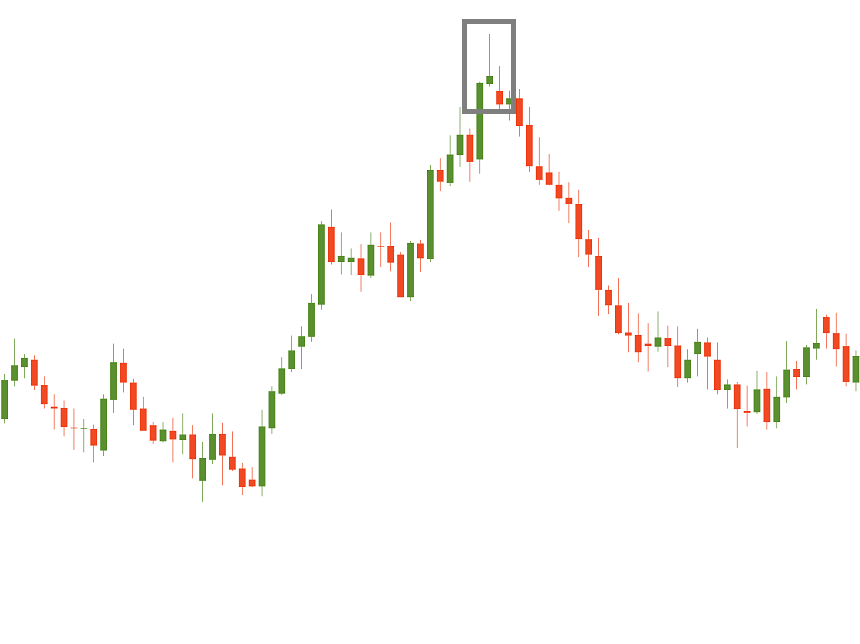
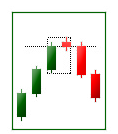
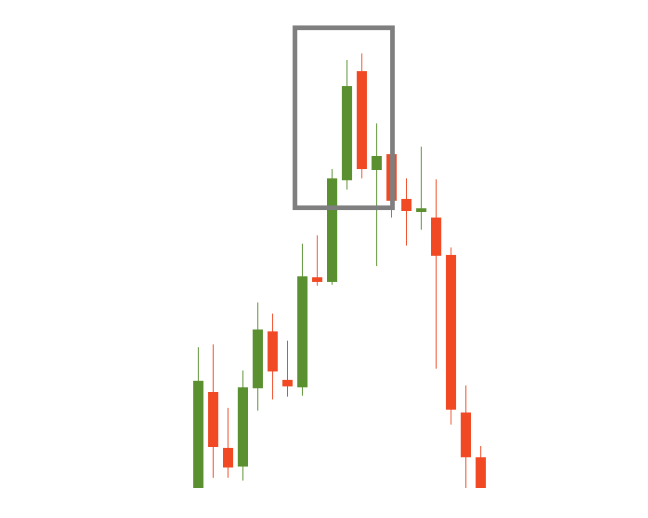
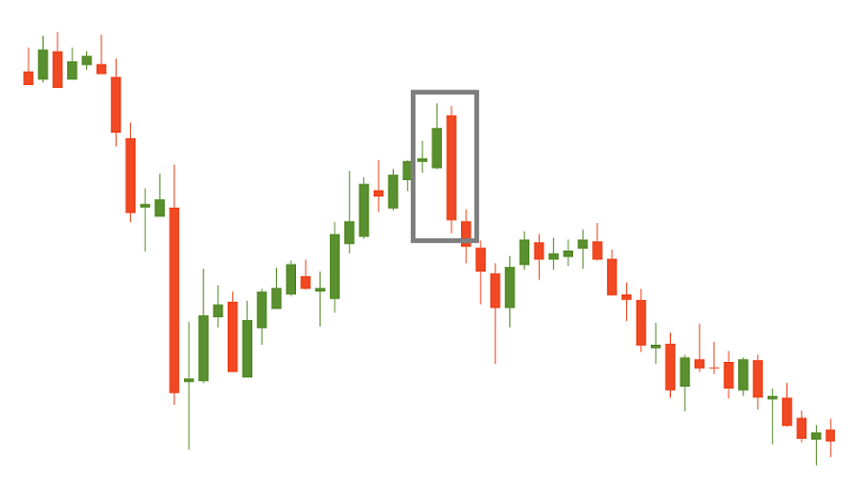
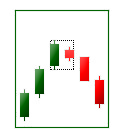
Dark cloud cover
A 2-candle pattern. The first candle is bullish and has a long body. The second candlestick should open significantly above the first one’s closing level and close below 50% of the first candlestick’s body. The sell signal is moderately strong.
Here’s an example of this pattern on a chart:
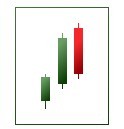
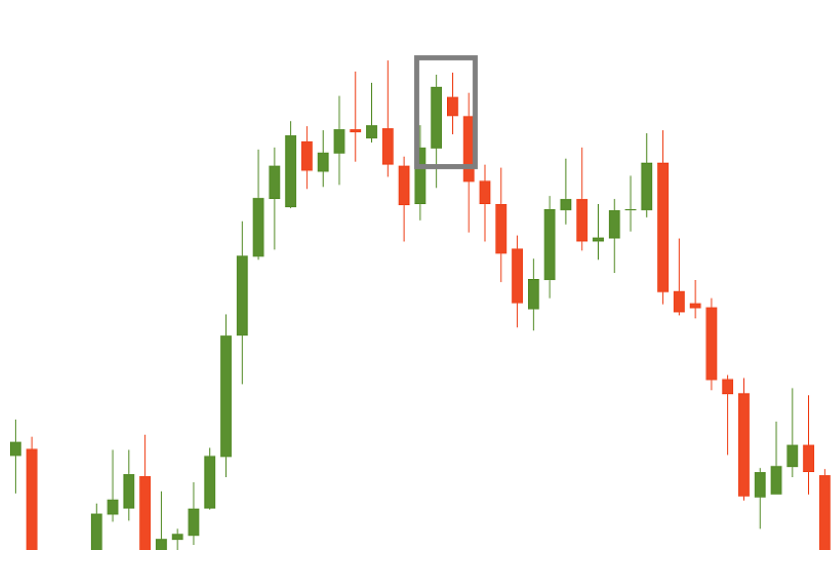
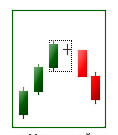
Bearish engulfing pattern
A 2-candle pattern. The first candlestick is bullish. The second candlestick is bearish and should open above the first candlestick’s high and close below its low.
This pattern produces a strong reversal signal as the bearish price action completely engulfs the bullish one. The bigger the difference in the size of the two candlesticks, the stronger the sell signal.
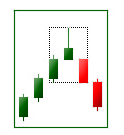
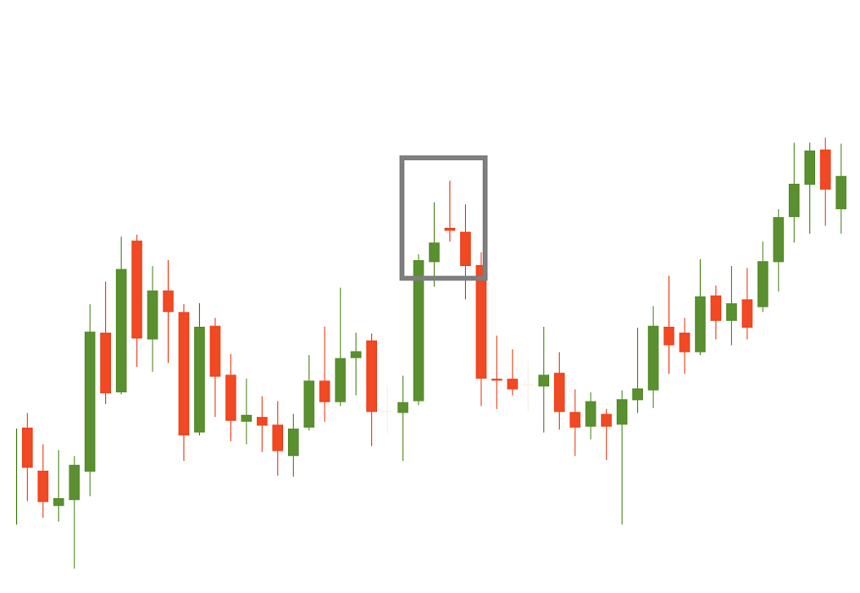
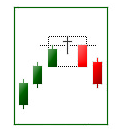
Bearish harami
A 2-candle pattern. The body of the second candle is completely contained within the body of the first one and has the opposite color.
Remember that harami patterns always require confirmation: the following candlestick should be big and bearish.
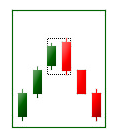
Bearish harami cross
A 2-candlestick pattern is similar to harami. The difference is that the second candlestick is a doji.
Three black crows
A 3-candlestick pattern. There’s a series of 3 bearish candles with long bodies. Each candle opens within the body of the previous one, better below its middle. Each candle closes at a new low, near its minimum.
The reliability of this pattern is very high, but still, a confirmation in the form of a bearish candlestick with a lower close or a gap-down is suggested.
Other articles in this section
- Fibonacci fan
- Fibonacci expansion
- How to Use Fibonacci Retracements
- How to deal with market noise?
- How to backtest a trading strategy
- Gator Oscillator
- Awesome Oscillator
- Ranges
- Alligator indicator
- Bill Williams theory
- Fractals
- Uncovering Gann indicators
- How to create your own trading strategy?
- Trend trading
- Carry trade
- Swing trading
- Position trading
- Day trading
- Scalping
- Trading styles
- Fibonacci tools
- Trader's psychology
- Japanese Candlesticks
- Trends
- Market conditions and phases
Choose your payment system


