Ranges
Information is not investment advice
Range trading takes place when the market has no clear direction. Neither bulls nor bears are able to start a trend, and the price moves sideways. Yet, the absence of an uptrend or a downtrend is not a reason to refrain from trading. It’s quite possible to achieve profit while the market is range-bound.
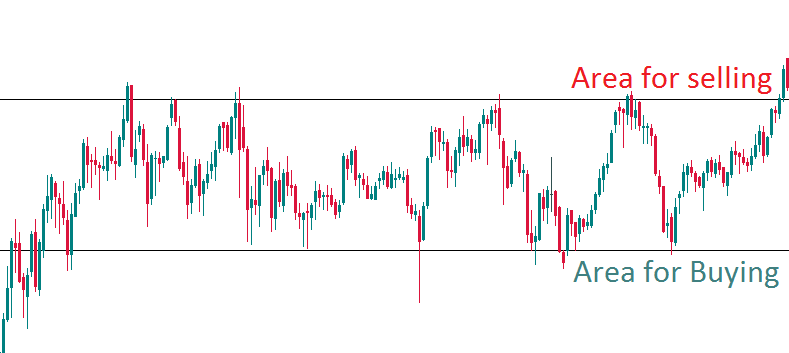
Range traders count on the fact that the prices will trade between the same horizontal levels for some time. They expect the price to rebound from both resistance and support many times. The goal of a trader is to benefit from the price’s fluctuations within the range by selling at the resistance and buying at the support.

Notice that the major currency pairs (EUR/USD, GBP/USD, USD/JPY, AUD/USD, NZD/USD, and USD/CAD) tend to trend more. They do have periods of consolidation, but still are less suitable for range trading. Crosses (EUR/GBP, CHF/JPY, AUD/CAD, and GBP/JPY) spend more time in ranges.
How to trade in a range?
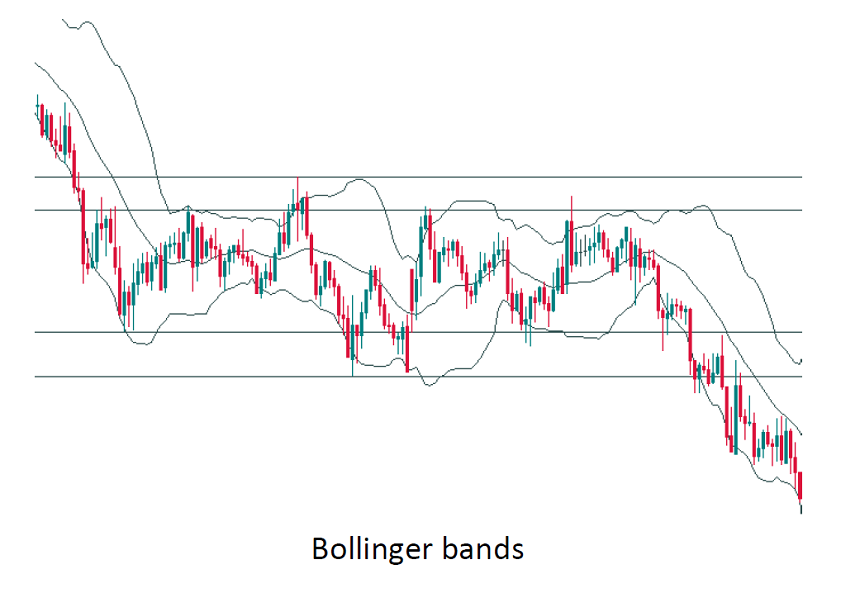
The first step for a range trader is to define the borders of the range or, in other words, find support and resistance. The simplest way to do so is to check the previous highs and lows of the chart. If the highs align at a horizontal line and so do the lows, you might have found the resistance and the support areas. Of course, in reality, the highs aren’t positioned exactly at the same line and neither are the lows. However, the market is not making higher highs and higher lows typical for an uptrend (or lower highs and lower lows that point at a downtrend). Bollinger bands can also help to track the borders of the range as they represent dynamic support and resistance that limit it.

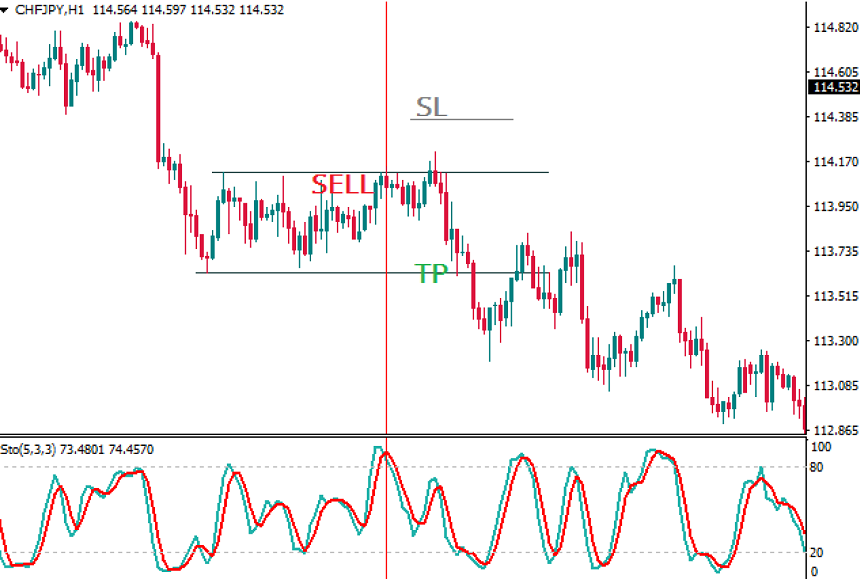
To second step is tracking overbought and oversold states of the price. The idea is to sell when a currency pair is overbought (at resistance) and buy when it becomes oversold (at support). To identify overbought/oversold conditions, traders use a type of technical indicators called “oscillators”. Such indicators rotate around a central level.
- When an oscillator rises from a central line and reaches an extreme area on the upside, it means that the pair is overbought. If the pair is at the time near the resistance zone, it’s time to sell.
- When an oscillator falls from a central line and reaches an extreme area on the downside, it means that the pair is oversold. If the pair is at the time near the support zone, it’s time to buy.
The most popular oscillators are RSI, CCI, and Stochastics. Stochastics seems to be the most sensitive to price action.
To sum up, the price’s getting to one of the range’s borders and the signal from an oscillator is the trigger for entering a trade. The probability of a successful trade will be higher if there’s a reversal candlestick pattern near the resistance/support.

Risk management
It’s always necessary to limit trading risks. The main risk for range traders is that the range is broken. Successful range trading strategy involves making small but consistent profits and minimizing losses.
Range trading is good when the market is not very volatile. As a result, it’s not recommended to trade in ranges when volatility spikes. News events can send the price far away in one direction. As a result, if you plan to do range trading, check the economic calendar to make sure that no important releases are scheduled for the currencies you have picked.
The rules for Take Profit and Stop Loss in range trading are very simple. TP is placed at the opposite side of the range, while SL is set at about half the amplitude of the range. This provides ample room for a drawdown while at the same time preserving a 2:1 reward to risk ratio. It’s not recommended to scale in or scale out of a position. Firstly, adding to a trade will unnecessarily increase your risk exposure. Secondly, there’s no real point in trying to partially close the trade as the TP is not that far away.
Conclusion
Range trading has a simple logic and can be mastered even by beginner traders. At the same time, it’s necessary to remember that while in range the market is in the situation of uncertainty. The borders of a range may be fluid and false breakouts may happen. As a result, this type of trading required disciplined risk management.
Other articles in this section
- Fibonacci fan
- Fibonacci expansion
- How to Use Fibonacci Retracements
- Reversal candlestick patterns
- Continuation candlestick patterns
- How to deal with market noise?
- How to backtest a trading strategy
- Gator Oscillator
- Awesome Oscillator
- Alligator indicator
- Bill Williams theory
- Fractals
- Chart patterns
- Uncovering Gann indicators
- How to create your own trading strategy?
- Candlestick patterns
- Trend trading
- Carry trade
- Swing trading
- Position trading
- Day trading
- Scalping
- Trading styles
- Fibonacci tools
- Trader's psychology
- How to identify market reversal
- Japanese Candlesticks
- Trends
- Market conditions and phases


