
Bill Williams is the creator of some of the most popular market indicators: Awesome Oscillator, Fractals, Alligator, and Gator.

Don’t waste your time – keep track of how NFP affects the US dollar!
Data Collection Notice
We maintain a record of your data to run this website. By clicking the button, you agree to our Privacy Policy.

Beginner Forex Book
Your ultimate guide through the world of trading.
Check Your Inbox!
In our email, you will find the Forex 101 book. Just tap the button to get it!
Risk warning: ᏟᖴᎠs are complex instruments and come with a high risk of losing money rapidly due to leverage.
68.53% of retail investor accounts lose money when trading ᏟᖴᎠs with this provider.
You should consider whether you understand how ᏟᖴᎠs work and whether you can afford to take the high risk of losing your money.
2022-12-28 • Updated
Information is not investment advice
In trading, we can rely on a bunch of different entry signals. While some can be calculated and defined with a strict mathematical formula, others are not that simple. You should be attentive to spot them and grab your reward. Three black crows pattern is one of these, so let’s break it down and see how it works and how to use it properly.
As you know, the most popular chart type is Japanese candlesticks. They are easy to read, informative, and used by most traders to predict future market movements. At a certain point, traders came up with the idea of identifying candlestick patterns. They usually look like a series of candlesticks, after which the price moves in a particular direction. Three black crows is one of the patterns used by traders to seek reversal candlestick patterns on a chart.
Notice that traders say black candle when they mean a bearish one. Generally, most traders use red candles to visualize a bearish movement. On the contrary, a white candle usually means a bullish one, with most traders using green candles instead of a white ones. The name came from the past when candlestick charts were black and white.
Now, as we have finished with the pattern definition, let’s move to the pattern itself. Three black crows pattern looks like three consecutive bearish trading sessions. Usually, there are little or no wicks on the candles, meaning bears took complete control of the situation. For example, the trading session after a bullish day started with a slight upside movement. Later that day, bears took control and pushed the price lower to the lower part of the previous day. The following two days were the same, pushing the price lower every time. By the end of the pattern, it usually looks as in the figure below.
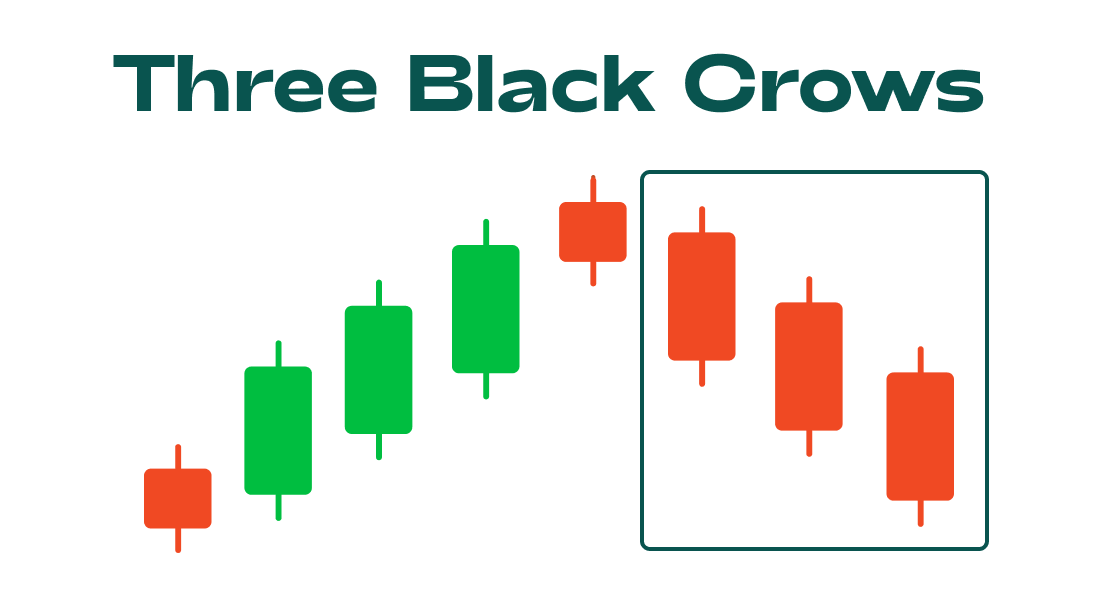
First, we need to explain how the market thinks it works and then how it actually works. The majority of traders suppose that Three black crows emerge close to the end of an uptrend and signal a potential reversal. The pattern should indicate that bears are in control of the price. Usually, trading tutorials teach people to seek buy entry after the pattern appears.
Indeed, some assets tend to follow this expectation and decrease after a series of red candles. For example, gold loves three black crows and usually moves lower after the pattern is finished. You can see it in the figure.
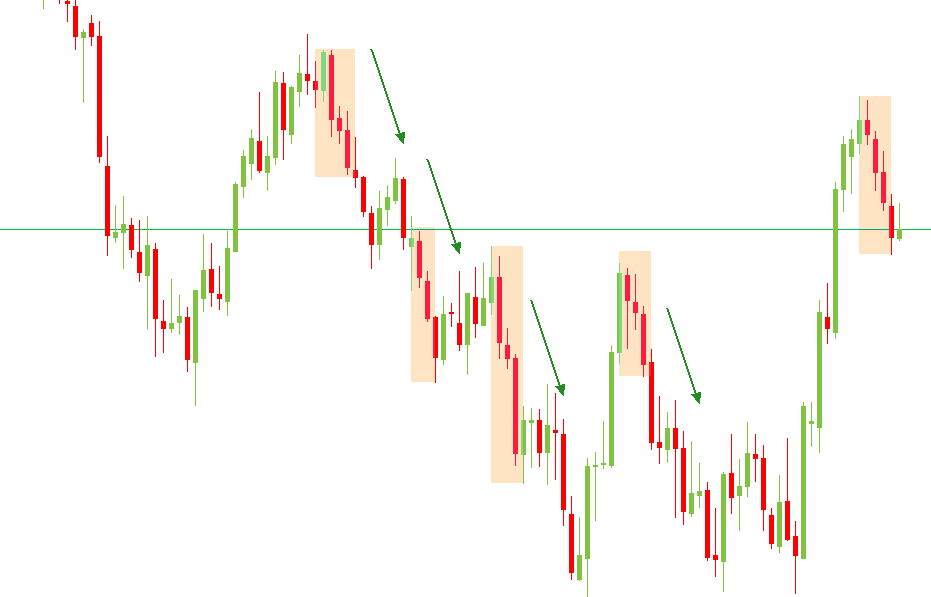
The examples above are not perfect because some patterns have a small first candle, which is not great. Still, at least three red candles are in each case, and the pattern worked perfectly four times in a row. If you entered each time and set a Stop Loss above the start of the pattern, you would profit. Notice that the chart above shows the Three black crows on a daily timeframe. Smaller timeframes tend to be more chaotic, but the overall tendency is likely to remain.
However, not all assets work with 3BC (three black crows) pattern. Some of them can be in an uptrend for years, decreasing the chance of having a reversal after several red trading sessions. For example, the US500 chart is going up after marking a decline with the pattern.
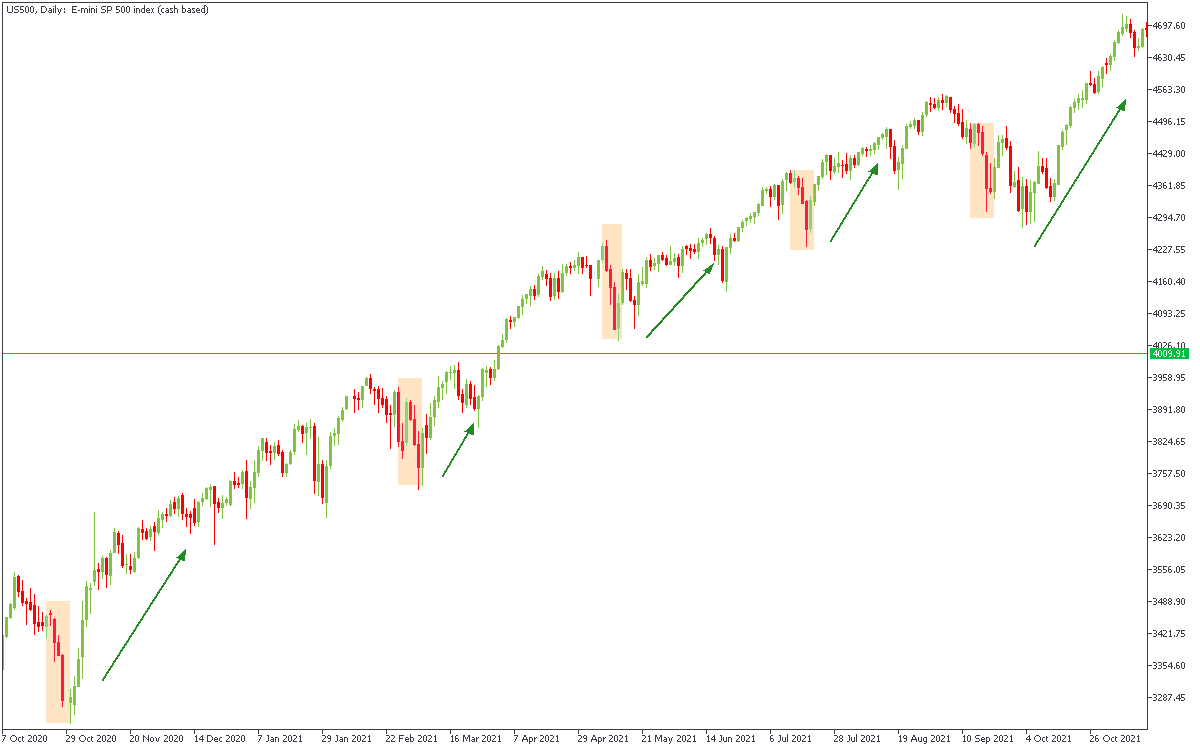
Trading the pattern on the US500 index would be a completely different experience. Every time you got a signal to Sell, the chart went up. This trend remained for the whole year, making it difficult for traders to earn by selling.
In this case, your attitude needs to be completely different from the classical interpretation of the pattern. In other words, you need to buy an asset every time it forms a 3BC. This way, you will have a lot of profitable trades, entering at the very bottom of the price swing. We will tell you about identifying the right way of trading the pattern later in this article.
Like any other price pattern, technical indicator, or candlestick formation, three black crows have pros and cons that depend on the timeframe you use, risk tolerance, and, most importantly, the asset you love to trade. Also, you need to understand market structure to identify how to act in each scenario.
As you can see, there are more cons than pros in trading the 3BC pattern. However, you can implement this pattern in your trading strategy, making it more reliable and less risky if you want to.
There are two ways of trading the pattern. First, we’ll tell you about the classical way of trading it and then move to the unusual one.
You need to find an uptrend and wait for a big red candle to appear. This candle should be at least half of the previous one, marking that sellers have entered the game.
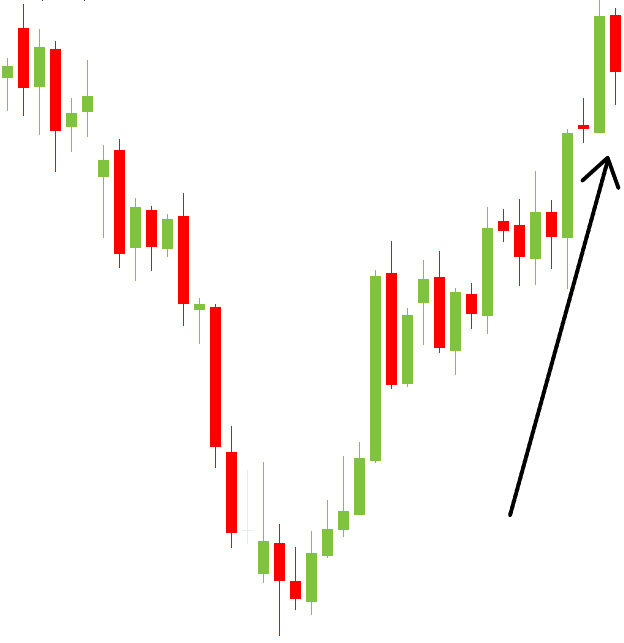
You don’t need to open a trade right away but watch at the next candle. After you see another two bearish candles, the chart should look like in the figure below.
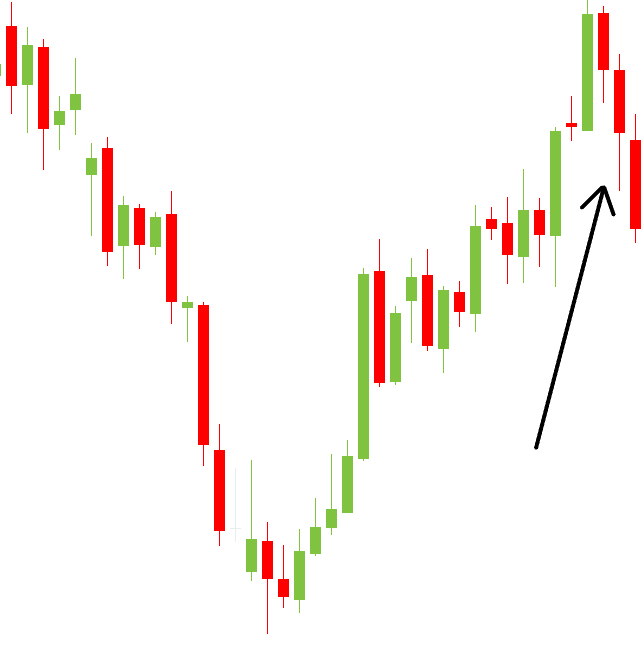
Now, you can open a sell trade right after the third candle closes. Your Stop Loss should be above the start of the movement, and your Take Profit should be at least as far as the Stop Loss. Risk management rules say that Take Profit should be twice as far, but we suggest closing half of the trade on the way to it make the trade less risky.
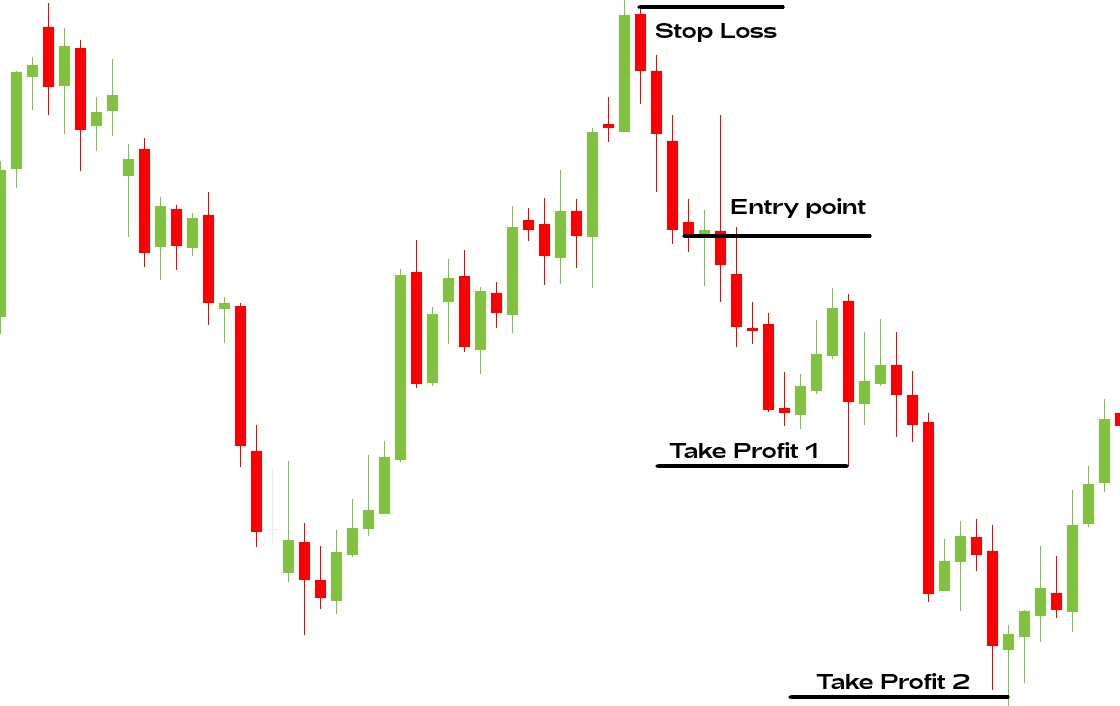
The example above briefly explained the classical way of trading the three black crows pattern. However, another way of using it is to open a Buy trade at the end of the third candle. The reason for trading counter-trend is that some instruments are more trendy than others. Gold, for example, can be in a trend for weeks and months but reverses eventually. On the other hand, the US500 index can remain in the uptrend for years, making short pullbacks on the way up.
As we know, the trend is your friend, and you should try to trade in the direction of the trend, not against it. Therefore, pullbacks in an uptrend are perfect for entering the buy trade. Here’s how to trade the three black crows pattern in a growing market:
As in the previous example, you need to find an uptrend and wait for three red candles to form.
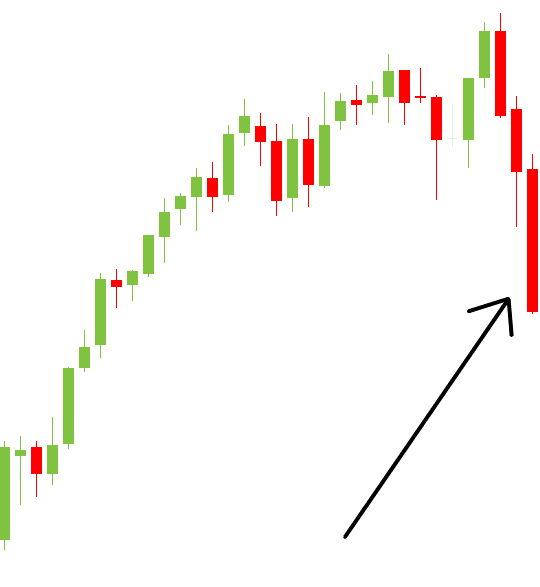
Next, you need to analyze the instrument and understand the market structure that prevails in it. Is it usually trendy or ranging? How big are pullbacks? These questions will help you to understand what is the best thing you can do after the pattern is ready. In our scenario, we have chosen to trade the US500 index, a trendy market with small and fast pullbacks (3-5 trading sessions). That’s why we enter a buy trade.
It’s easy to place a Stop Loss when trading in the direction of a movement, but what about trading reversals? Then it would be best if you placed your Take Profit first. Put it at the upper border of the highest candle’s body. A Stop Loss can be half as far as the Take Profit. The final result may look like this.
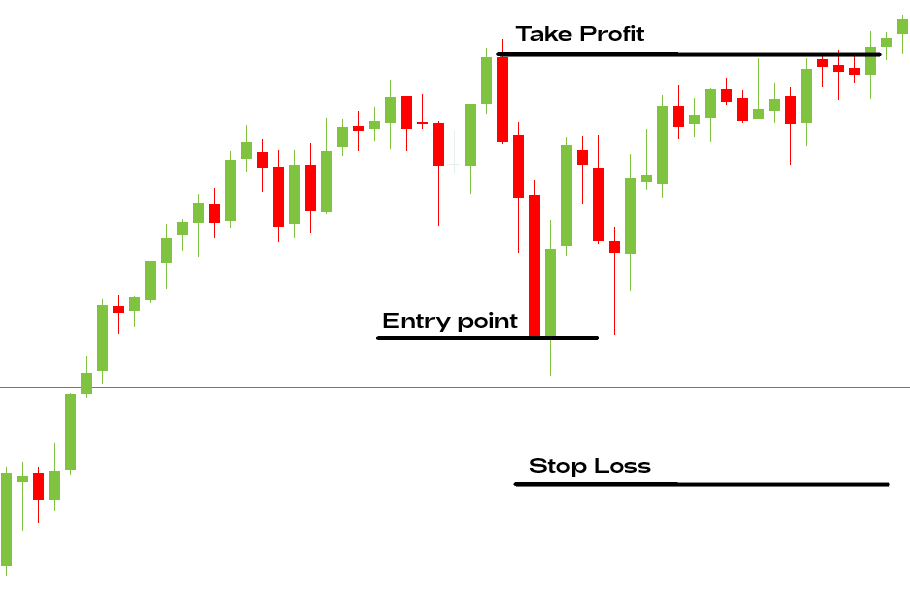
Don’t forget to analyze the instrument before making any decisions. This pattern isn’t as straightforward as you might want it to be. Therefore, a comprehensive market analysis is a must for every trader of the three black crows pattern. Notice that MT4 and MT5 that we support, among many others support candlestick charts, so you can find this pattern here.
The three black crows pattern isn’t a usual candlestick formation. It comes with its pros and cons. We recommend this pattern for traders familiar with market structure, risk management, and differences between trendy and ranging markets. However, if used right, the three black crows pattern provides easy-to-spot entry signals.

Bill Williams is the creator of some of the most popular market indicators: Awesome Oscillator, Fractals, Alligator, and Gator.

Trend strategies are good - they may give significantly good results in any time frame and with any assets. The main idea of the ADX Trend-Based strategy is to try to catch the beginning of the trend.

Counter-trend strategies are always the most dangerous but also the most profitable. We are pleased to present an excellent counter-trend strategy for working in any market and with any assets.
Your request is accepted.
We will call you at the time interval that you chose
Next callback request for this phone number will be available in 00:30:00
If you have an urgent issue please contact us via
Live chat
Internal error. Please try again later