


Guide du débutant pour les meilleures figures de day trading
En termes simples, les figures dans le day trading correspondent aux formes du graphique des prix. Ces formes permettent aux traders de déterminer la direction potentielle du mouvement des prix.
Pour éviter qu'un trader novice ne soit perdu avec la variété des formes, dans cet article, nous allons décomposer les modèles de base du day trading et vous montrer comment les utiliser.
Figures de trading pour les débutants
Les figures de trading sont essentielles car les graphiques ont tendance à produire des signaux fréquents qui permettent d'éviter le bruit de l'action des prix. Reconnaître et interpréter ces figures peut vous aider à vous faire une idée précise et à repérer des signaux de trading pour prédire l'évolution future des prix.
Les différentes figures ont des objectifs différents, et la première chose à apprendre est de les distinguer.
Lorsque vous utilisez l'analyse technique pour trader, vous devez avant tout prêter attention aux figures chartistes. Il existe plusieurs types de figures chartistes couramment utilisées pour faire du trading. Certaines des plus populaires sont :
- Double sommet ;
- Double creux ;
- Épaule-Tête-Épaule (ETE) ;
- Épaule-Tête-Épaule inversé ;
- Triangle (descendant, ascendant ou symétrique) ;
- Canal (horizontal, descendant ou ascendant) ;
- Poursuite d'une tendance haussière ou baissière ;
- Biseau descendant ou ascendant.
En plus des figures chartistes, les traders peuvent utiliser des figures de chandeliers japonais. Nous examinerons plus en détail les plus populaires pour le day trading dans la suite de cet article.
Qu'est-ce qu'une figure chartiste ?
Sur n'importe quel terminal de trading, vous pouvez utiliser différentes méthodes pour analyser le marché à l'aide de l'analyse technique. Elle regroupe des techniques et des outils durables qui vous permettent d'analyser la situation actuelle sur le graphique.
Un graphique est un ensemble de prix superposés, le plus souvent, sur un intervalle de temps. En règle générale, l'ordonnée du graphique représente l'échelle des prix et l'abscisse l'échelle de temps. Les prix des actifs sont tracés de gauche à droite, de sorte que la partie droite du graphique présente les données les plus récentes.
Les graphiques vous permettent d'obtenir rapidement des données sur le marché, telles que la corrélation entre les acheteurs et les vendeurs, la tendance dominante et la valeur du prix dans le temps, pour effectuer une analyse technique sur la base de ces informations et prédire ce que sera le prix d'un actif.
Les traders appliquent généralement différents outils sur le graphique pour améliorer et accélérer l'analyse. Ces outils prévoient l'application de lignes horizontales (support et résistance) et de lignes de tendance. Les lignes de tendance sont les lignes du graphique qui déterminent la direction du prix. Si le prix forme des hauts et des bas plus élevés, il s'agit d'une tendance à la hausse. À l'inverse, si le prix forme des hauts inférieurs et des bas inférieurs, il s'agit d'une tendance à la baisse.
Par conséquent, une figure chartiste est une combinaison de lignes de support et de résistance qui permettent de déterminer si la tendance va s'inverser ou se poursuivre.
Pour le day trading, les traders utilisent des intervalles de temps plus courts pour voir les mouvements à court terme du prix.
Pourquoi les figures chartistes sont-elles importantes ?
Une fusion de statistiques, de mathématiques et de sociologie peut être utilisée pour prédire les mouvements des cours des actions. La règle fondamentale de ce type d'analyse est que l'histoire se répète. Lorsque des figures chartistes apparaissent, un trader comprend qu'il est très probable que le prix se comporte de la même manière qu'il l'a fait dans la plupart des cas lorsque cette figure est apparue sur le graphique auparavant.
Les investisseurs utilisent souvent des figures dans le cadre de l'analyse graphique du cours de l'action d'une société pendant la période en cours, en plus de l'analyse fondamentale. Si l'activité d'un émetteur est en plein essor, qu'il surpasse ses concurrents et que le marché est prometteur, des figures peuvent être utilisées pour sélectionner un point d'entrée spécifique. Il est plus pratique de superposer les figures sur un graphique en chandelier, ce qui permet de suivre plus facilement les fluctuations de prix.
Les figures de day trading sont basées sur des preuves empiriques de traders. Les documents de recherche nient généralement l'efficacité à long terme des figures chartistes, car la valeur attendue de ces figures est inférieure à 0,5. Cependant, trader à partir de figures graphiques et comprendre en profondeur les mouvements de prix peut s'avérer payant.
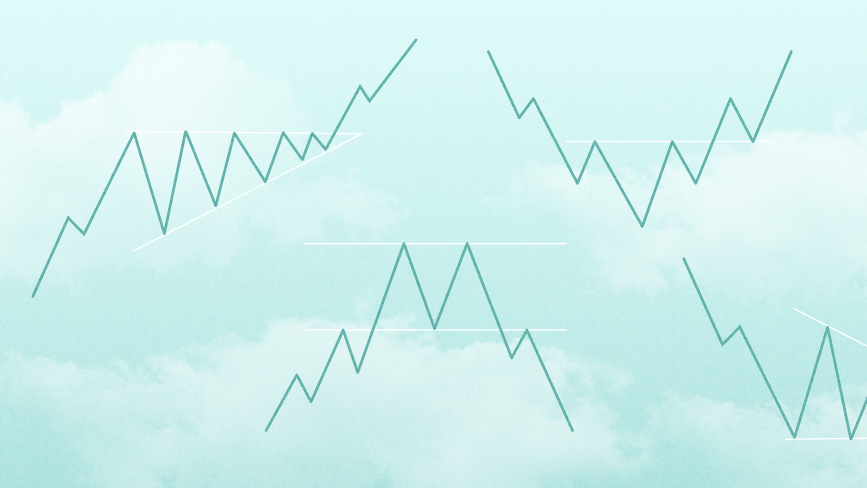
Types de figures chartistes
Il existe de nombreuses figures chartiste, portant parfois des noms fantaisistes, comme les figures en zigzag. Les deux figures de continuation les plus utilisées par les day traders sont le drapeau et le fanion. La figure du fanion est semblable à un triangle symétrique ; la figure du drapeau est semblable à un rectangle. Ce sont des tendances communes puissantes. Une fois qu'un trader a compris ces figures, il peut obtenir de meilleurs résultats.
Fanion
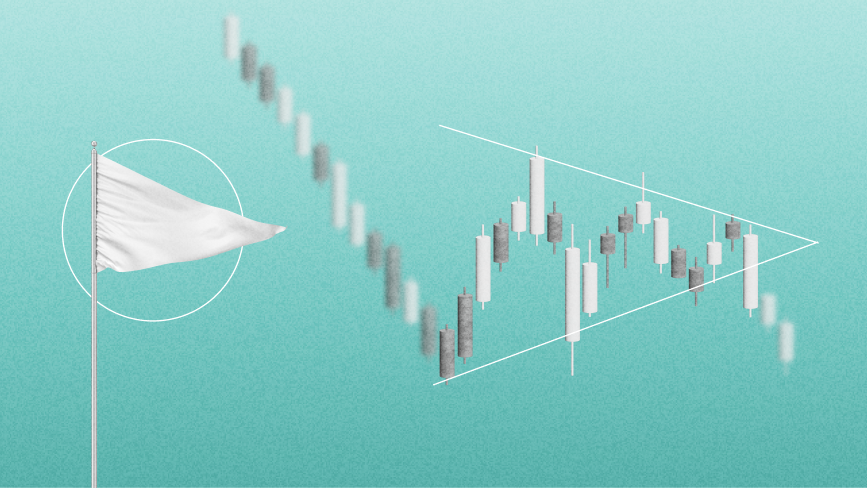
Cette figure est souvent appelée triangle. La limite supérieure du fanion est dirigée vers le bas, et la limite inférieure est dirigée vers le haut. La fourchette de prix s'estompe à chaque changement de direction, dessinant un couloir de plus en plus étroit. Cette figure se retrouve souvent après de fortes impulsions de l'actif dans la direction de la tendance principale.
Le signal pour entrer dans un trade apparaît après la rupture de la frontière du fanion dans la direction de la tendance principale. Dans le cas d'une tendance à la baisse, l'image est inversée.
Drapeau
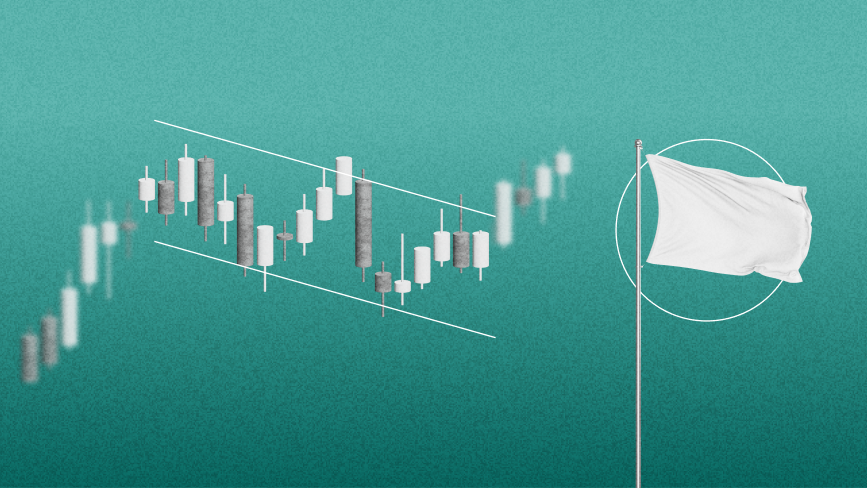
Une figure de continuation, qui se dirige contre la tendance principale. Il apparaît souvent après un fort mouvement sur le graphique et montre que les ours ont confondu une petite correction avec un retournement, et que certains vendeurs ouvrent des positions. À un moment donné, les acheteurs se battent à nouveau, la limite du canal est brisée et la tendance continue dans l'ancienne direction. Pour entrer dans un trade, on utilise la rupture des limites du drapeau dans la direction de la tendance principale.
Figures de chandeliers
Les chandeliers japonais sont la plus ancienne méthode d'analyse technique connue au monde. Le graphique en chandelier est l'un des graphiques les plus populaires, qui permet aux traders d'interpréter rapidement et facilement les informations sur les prix.
Au fil du temps, les chandeliers individuels forment des figures que les traders peuvent utiliser pour reconnaître les principaux niveaux de support et de résistance. Il existe de nombreuses figures de chandeliers qui indiquent des opportunités sur le marché. Certaines indiquent l'équilibre entre la pression d'achat et de vente, tandis que d'autres identifient des figures de continuation ou l'indécision du marché.
Une série de chandeliers sur le graphique permet aux traders de déterminer avec plus de précision la nature du mouvement des prix sur le marché et, par conséquent, de faciliter la prise de décision.
Pour comprendre cela, examinons quelques figures de chandeliers de base, qui sont utiles pour le day trading.
Chandelier en étoile filante
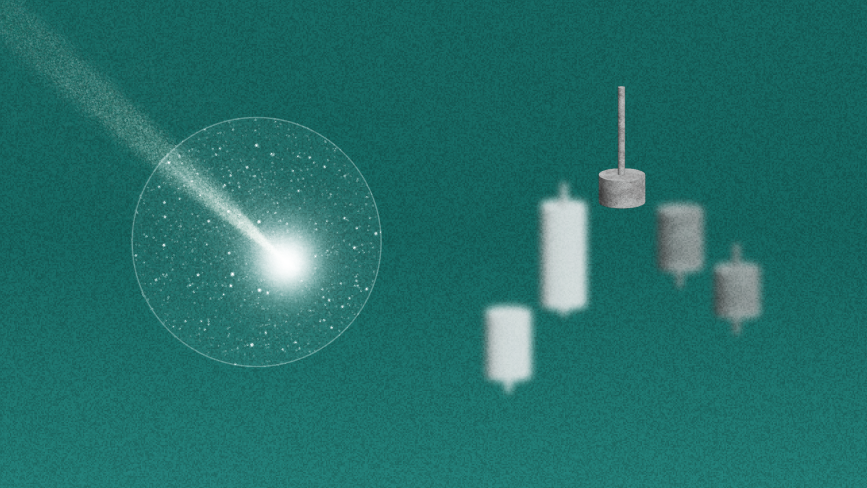
Une figure en étoile filante apparaît lorsque le marché est en hausse et annonce l'arrivée imminente d'une tendance à la baisse. Graphiquement, l'étoile filante est une bougie courte avec une ombre inférieure absente et une ombre supérieure très longue. La couleur de la bougie n'est généralement pas importante, mais en général, une figure avec une bougie noire (rouge) sera plus forte.
Chandelier en marteau
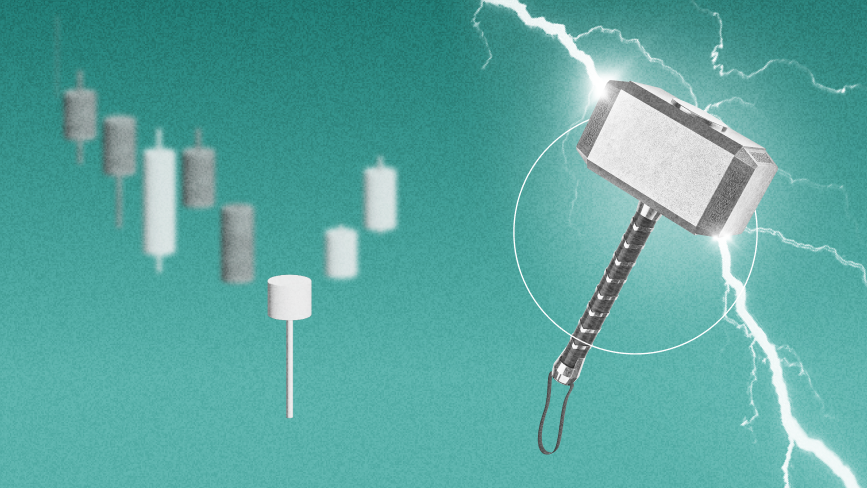
Le chandelier en marteau, au contraire, signale le passage d'une tendance à la baisse à une tendance à la hausse. Il s'agit d'une petite bougie avec une longue ombre inférieure. L'ombre supérieure est soit absente, soit très petite. Pour le trading sur des intervalles de temps courts, un marteau blanc (vert) sera plus fort qu'un marteau noir (rouge). Mais sur des intervalles de temps plus longs, cela n'a pas beaucoup d'importance.
Englobante haussière et baissière

Les figures englobantes haussières et baissières font partie des meilleures figures de chandeliers pour le day trading. Une bougie englobante haussière se forme lorsque le corps d'une bougie blanche (verte) englobe complètement la bougie noire (rouge) précédente, ce qui signale une forte impulsion d'achat.
Semblable à l'englobante haussière, une figure englobante baissière se forme lorsqu'une bougie baissière consume la bougie haussière précédente, ce qui signale une forte impulsion de vente.
Conclusion
Les figures de day trading peuvent produire des signaux de trading, dont l'identification correcte vous permettra de comprendre les subtilités des marchés financiers. L'expérience de nombreux traders prospères confirme leur efficacité.
Malgré leur valeur, les graphiques ne sont qu'un des nombreux outils à la disposition d'un trader. Il est également important de tenir compte des actualités, des événements, des recherches et des analyses de marché pour prendre des décisions de trading éclairées. Quelle que soit la situation, vous devez être prudent et mieux vaut ne pas investir plus que ce que vous pouvez vous permettre de perdre.