ADX
Les informations données ne sont pas des conseils en investissement
L'indice directionnel moyen (ou ADX) est un indicateur de force de tendance. Les traders de tendance veulent trouver des tendances fortes et ouvrir des positions dans leurs directions. L'ADX permet de juger de la force d'une tendance.
L'indicateur se base sur une moyenne mobile de l'expansion d'un range de prix sur une période donnée.
Comment l'appliquer
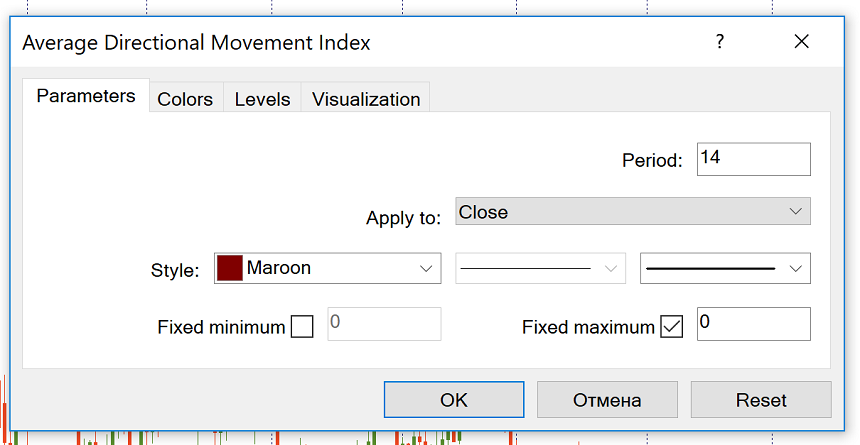
Vous pouvez ajouter l'ADX à un graphique en cliquant sur "Insert > Indicators > Trend", puis en sélectionnant "Average Directional Movement Index".

Par défaut, le nombre de périodes est défini sur 14. Vous pouvez changer ce nombre si vous le souhaitez.
Comment l'utiliser ADX indicateur
L’indicateur MT4 inclut automatiquement 3 lignes :
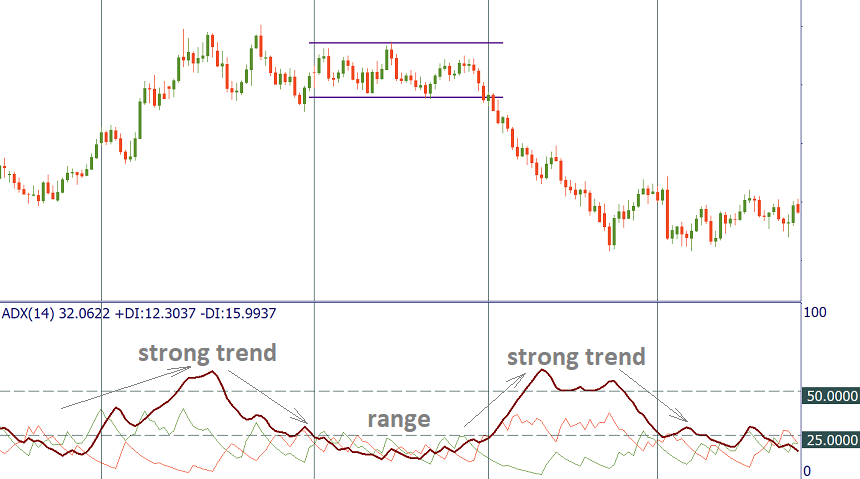
- L'Index directionnel moyen (ADX) lui-même (ligne marron épaisse). Ses valeurs vont de 0 à 100. Cette ligne enregistre la force d’une tendance mais n’indique pas sa direction.
- L’indicateur de mouvement directionnel Plus (+ DMI) (ligne verte) représente la différence entre deux maximums consécutifs.
- L'indicateur de mouvement directionnel Moins (-DMI) (ligne rouge) représente la différence entre deux minimums consécutifs.
La ligne ADX est utilisée pour déterminer si un actif présente une tendance ou non. Lorsque l'ADX au dessus de 25, une forte tendance se dessine. Il est donc judicieux de recourir à des stratégies de trading de tendances. Par conséquent, lorsque l’ADX est inférieur à 25, il est préférable d’éviter le trading sur tendance et de choisir une stratégie de trading par range approprié. Dans de tels moments, le prix entre dans un range. Il est nécessaire de préciser que l’ADX peut être utilisé pour confirmer la rupture d’une plage. Lorsque l'ADX passe de moins de 25 à plus de 25, cela signifie que le prix est suffisamment élevé pour continuer dans la direction de la rupture.Il y a plus de niveaux de la valeur ADX. Vous pouvez les découvrir dans le tableau ci-dessous :
Valeur ADX
| Force de | la tendance |
| 0-25 | Tendance absente ou faible |
| 25-50 | Forte tendance |
| 50-75 | Tendance Très Forte |
| 75-100 | Tendance extrêmement forte |
Globalement, lorsque la ligne ADX augmente, la tendance tend à augmenter et le prix évolue dans le sens de la tendance. Lorsque la ligne diminue, la tendance tend à diminuer et le prix subit une correction ou une consolidation. Notez que la ligne ADX en baisse ne signifie pas qu’une tendance est en train de s’inverser. Cela signifie simplement que la tendance actuelle s’affaiblit.

De plus, si vous regardez la série des pics ADX, vous obtiendrez des informations sur l’élan du momentum de la tendance. S'il existe une série de pics ADX plus élevés, la tendance tend à se renforcer. Cela permettra à un trader de savoir qu'il peut garder les trades de tendance ouverts en laissant les profits courir. Une série de pics ADX plus bas signifie que le momentum de la tendance diminue. Sachez que, malgré le ralentissement, la tendance pourrait se poursuivre. Néanmoins, dans ce cas, il faut être plus attentif et sélectif à propos des nouveaux signaux d'entrée. Il pourrait être judicieux de resserrer les limites des positions existantes ou d’envisager des take profit partiels.
Signaux classiques de l'ADX
+DMI et -DMI définissent le mouvement directionnel. En général, les hausses prédominent lorsque +DMI est supérieur à -DMI, tandis que les baissiers ont l'avantage lorsque -DMI est supérieur à +DMI. Les croisements de +DMI et DMI constituent un système de trading en combinaison avec l'ADX.
Le signal d'achat survient lorsque +DMI passe au-dessus de -DMI (ADX doit être supérieur à 25). Le stop-loss est généralement placé au plus bas du jour du signal. Le signal d'achat reste en vigueur tant que ce minimum est maintenu, même si +DMI repasse en dessous de -DMI.
Et inversement, le signal de vente se produit lorsque -DMI passe au-dessus de +DMI (l'ADX doit être supérieur à 25). Le plus haut du jour du signal devient le stop-loss initial.
Conclusion.
L'indice directionnel moyen est un outil très utile pour les traders de tendance. Il est recommandé d’utiliser l’ADX en combinaison avec l’analyse de l’évolution des prix et d’autres indicateurs techniques.
Autres articles de cette section
- Intervalles de temps
- Graphique en Renko
- Types de graphiques
- Heiken Ashi
- Politique d'assouplissement quantitatif
- Points Pivots
- Moyenne mobile : un moyen simple de trouver une tendance
- Williams’ Percent Range (%R)
- RVI (Relative Volatility Index)
- Momentum
- Indice de force
- Enveloppes
- La Puissance des Haussiers (Bulls Power) et la Puissance des Baissiers (Bears Power)
- Indicateur Average True Range (ATR)
- Comment trader en se basant sur les décisions des banques centrales ?
- CCI
- Parabolique SAR
- Stochastique
- RSI (Indice de force relative)
- Oscillateurs
- Bandes de Bollinger
- Indicateurs de tendance
- Introduction aux indicateurs techniques
- Support et résistance
- Tendance
- Analyse technique
- Banques centrales : politique et effets
- Facteurs fondamentaux
- Analyse fondamentale
- Analyse technique vs analyse fondamentale


