


Williams’ Strategy
Bill Williams is the creator of some of the most popular market indicators: Awesome Oscillator, Fractals, Alligator, and Gator.

Don’t waste your time – keep track of how NFP affects the US dollar!
Data Collection Notice
We maintain a record of your data to run this website. By clicking the button, you agree to our Privacy Policy.

Beginner Forex Book
Your ultimate guide through the world of trading.

Check Your Inbox!
In our email, you will find the Forex 101 book. Just tap the button to get it!
Risk warning: CFDs are complex instruments and come with a high risk of losing money rapidly due to leverage.
66.43% of retail investor accounts lose money when trading CFDs with this provider.
You should consider whether you understand how CFDs work and whether you can afford to take the high risk of losing your money.
Warning! Old version of the browser!
Press one of the icons below to proceed to the official website of the developer and download the latest version of your browser.

Online Forex broker
2022-08-26 • Updated
Information is not investment advice
Sometimes prices in the market fluctuate quite a lot, and sometimes the market is completely calm. Some experts compare the market with the sea. When the sea is quiet, there are practically no waves. However, if a storm occurs, waves can reach a height of several meters.
Volatility reflects momentum in the market. A very volatile market sees many movements. A trader can easily distinguish moments of high market volatility by looking at a chart. If there are many big swings, this is a volatile market. On the other hand, the volatility is low if a price trades in a range with minimum swings.
One way to measure an asset’s volatility is to quantify its daily returns (daily move in percent). Historical volatility is based on historical prices and represents the degree of variability in returns.
Any market goes through varying degrees of volatility. For example, we can notice the price acts differently during different periods on the chart below. Sometimes it makes many significant movements. Other times volatility declined, and the price trades within a small range.
By looking at any chart, traders can find a period when an instrument goes through high and low volatility periods. It creates an opportunity for implementing a volatility breakout method.
The main goal for a trader who uses a volatility breakout strategy is to capture a moment of rising volatility. A trader needs to notice the moment when the market switches from a ranging mode to a trending one. Traders can use this system on any timeframe and in all markets. There are various approaches, helpful tools, and indicators.
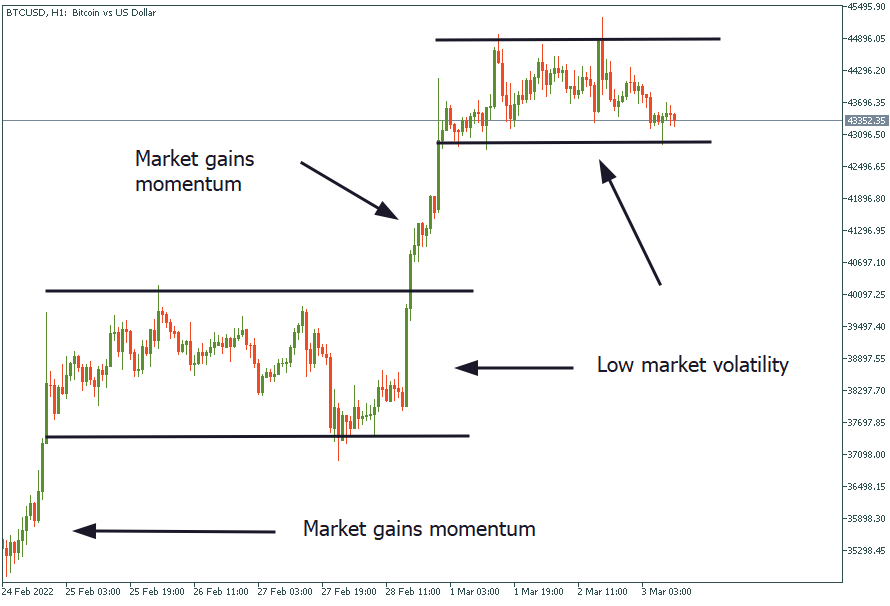
The chart above presents an example of the most basic type of volatility breakout trade. We can see that the initial price was trending higher with plenty of volatility in the market. However, in the middle of the chart, it settled into a range as volatility dried up.
When a trader notices a price pausing like this, he/she can go ahead and draw support and resistance lines, marking the swing high and the corrective low of this market pause. After that, the trader needs to monitor the market, wait for a breakout of this range, and follow a trend.
It’s important to realize that the volatility breakout system works better in cases of trend continuation. In the picture above, the price had been trending upwards before the range started. If the price breaks above the resistance line, a trader will enter the market. If the price breaks below the range, this will be a counter-trend trade and is not something a trader would like to trade with this system.
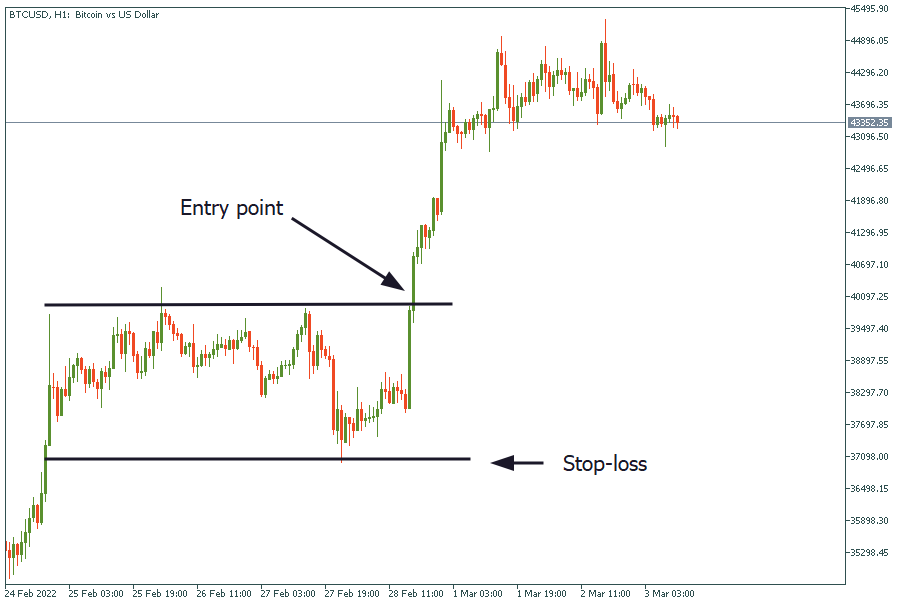
This system is straightforward and only relies on a trader's ability to draw support and resistance lines. A trader can set a pending price order above the resistance to capture the volatility breakout if they aren’t in front of the charts. Such order is called ‘Buy Stop’.
In this scenario, a trader opens a buy trade only after the price breaks through the resistance. To comply with risk management, they need to place a Stop Loss order below the support line of the range. In this case, the target should give a minimum twice as big a profit as the risk. This method helps to achieve a positive risk-reward trading ratio.
Many traders prefer to improve this strategy with technical indicators, which can be incredibly useful for trading a volatility expansion. Bollinger Bands is one of the most popular indicators to use for such a purpose.
The Bollinger Bands is a technical indicator used to measure volatility and trend direction. The indicator comprises a 20-period moving average (the line in the middle of the bands) and upper and lower bands that mark two standard deviations above and below the average. The purpose of the indicator is to measure volatility in the market and identify a trend. A wide range between bands signals high market volatility. Vice versa, narrow bands mean that volatility has subsided and the market trades within a range. Moreover, the direction of BB helps traders define whether there is an uptrend or a downtrend.
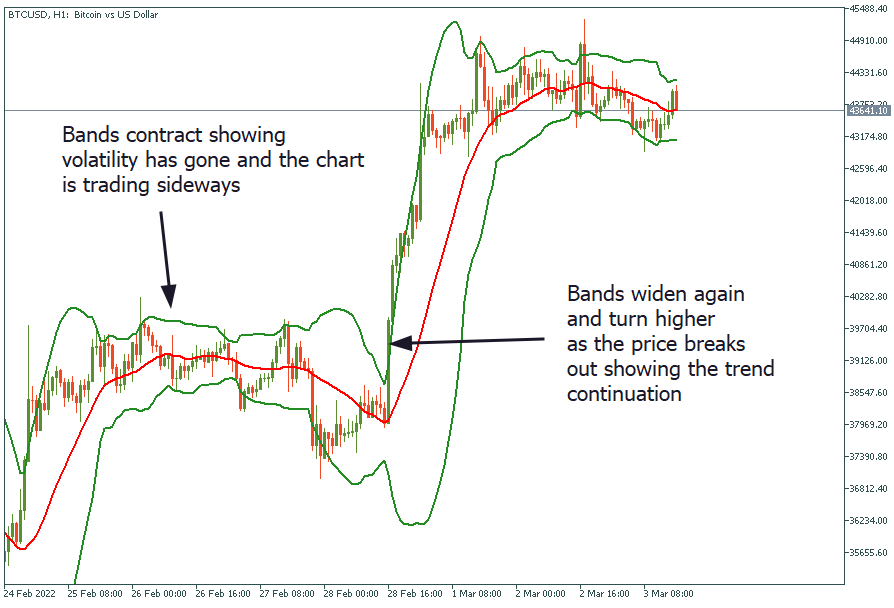
The chart above shows how useful this indicator can be. First, it highlights the trend. Moreover, the indicator shows chart spots with high volatility, as well as places of the price’s consolidation.
BB indicator contracts when a price pauses and consolidates since the market loses volatility. However, as price breaks above the top of the bands, the volatility returns and shows that the bullish trend is continuing.
According to this strategy, traders should open trade as soon as the price breaks above the top of the bands. In this case, it’s necessary to put a Stop Loss below the lower border of the bands.
There are two options to manage this trade. First, one can simply follow the previous settings and set a Take Profit order that twice exceeds the risk, i.e. the Stop Loss. Alternatively, it’s possible to use the Bollinger Bands indicator to manage the trade.
As you know, the central line of the Bollinger Bands indicator is a moving average. Therefore, traders can manage this trade the same way when trading with a moving average: keep a trade open until the price touches a moving average because that would suggest that the trend losses momentum.
Another approach uses Bollinger Bands, whereby traders keep a trade open until the price touches the lower band. Suppose the price comes back down and touches the bottom of the Bollinger Bands. It means that price is either settling into another range and a trader can take profit and wait for another opportunity to open a buy trade, or the price is potentially reversing.
The volatility breakout strategy is one of the highest profitability trading strategies. It can be used on all markets and timeframes. Moreover, it is simple to learn and easy to use, as it requires nothing more than knowledge about support and resistance levels, and trend recognition. This strategy fits newbies and experienced traders due to its variability and unlimited improvement possibilities.

Bill Williams is the creator of some of the most popular market indicators: Awesome Oscillator, Fractals, Alligator, and Gator.

Trend strategies are good - they may give significantly good results in any time frame and with any assets. The main idea of the ADX Trend-Based strategy is to try to catch the beginning of the trend.

Counter-trend strategies are always the most dangerous but also the most profitable. We are pleased to present an excellent counter-trend strategy for working in any market and with any assets.


Your request is accepted.
We will call you at the time interval that you chose
Next callback request for this phone number will be available in 00:30:00
If you have an urgent issue please contact us via
Live chat
Internal error. Please try again later