

Williams’ Strategy
Bill Williams is the creator of some of the most popular market indicators: Awesome Oscillator, Fractals, Alligator, and Gator.

Don’t waste your time – keep track of how NFP affects the US dollar!
Data Collection Notice
We maintain a record of your data to run this website. By clicking the button, you agree to our Privacy Policy.

Beginner Forex Book
Your ultimate guide through the world of trading.

Check Your Inbox!
In our email, you will find the Forex 101 book. Just tap the button to get it!
Risk warning: ᏟᖴᎠs are complex instruments and come with a high risk of losing money rapidly due to leverage.
70.72% of retail investor accounts lose money when trading ᏟᖴᎠs with this provider.
You should consider whether you understand how ᏟᖴᎠs work and whether you can afford to take the high risk of losing your money.
Warning! Old version of the browser!
Press one of the icons below to proceed to the official website of the developer and download the latest version of your browser.

Online Forex broker
2022-08-26 • Updated
Information is not investment advice
A shooting star pattern is really popular among traders because of its simplicity and effectiveness. Elsewhere, this pattern has a significant advantage – it occurs on the charts quite often, so it won’t take too much time to find it. In this article, we will discuss what the shooting star pattern is, how to recognize it, and how you can use it in your trading. Let’s get started!
Look at the picture below – it is the shooting star!
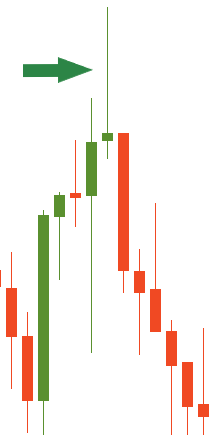
A candlestick roughly represents the tug-of-war between buyers and sellers. If a candlestick grows up, it means that there are more buyers or bulls on the market. Therefore, the price rises. On the flip side, if a candlestick goes down, there are more sellers or bears on the market. As a result, the price moves downward.
The long upper tail of a shooting star shows that bulls (buyers) were trying to push the price higher, but by the end of the session more bears (sellers) appeared, and they pulled the price lower. In other words, higher prices were rejected, so the price moved down. That’s why the price is likely to go down in the next session as well.
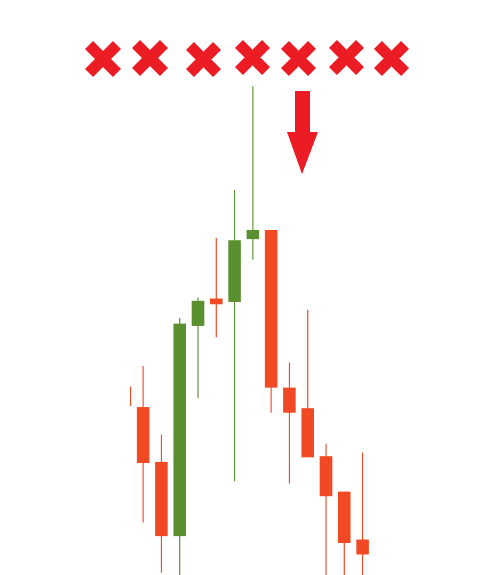
Great! You’ve learned what a shooting star is and how to identify it. Now the time to know how to use it! There is a simple trading strategy. First of all, you open the chart and try to find a shooting star. Once you’ve noticed the formation of the shooting star, you should wait for the next candlestick to move below the low of the shooting star you’ve just found. You need to do that to make sure the candlestick pattern confirms itself. The perfect market entry will be exactly at the time when this confirmation happens. You can use a sell stop entry to do this automatically.
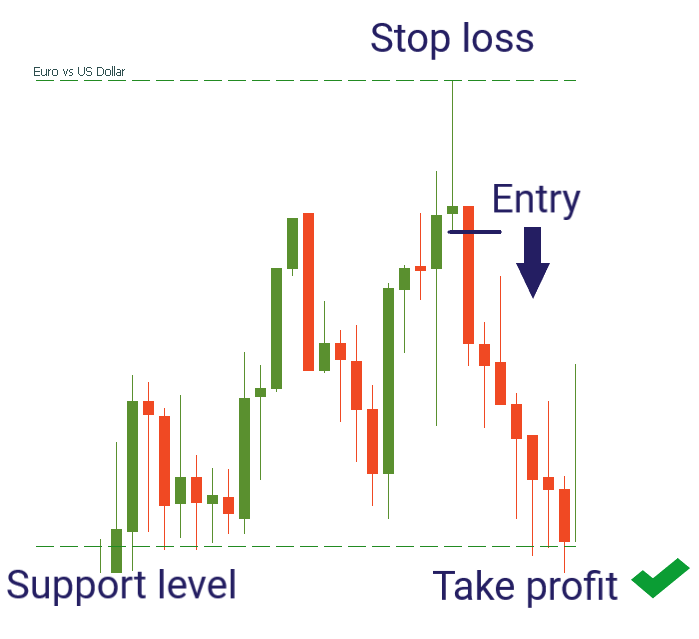
Let’s try this strategy on the EUR/USD chart.
Awesome! You’ve just leveled up your trading skills! Try it in Demo Account.

Bill Williams is the creator of some of the most popular market indicators: Awesome Oscillator, Fractals, Alligator, and Gator.

Trend strategies are good - they may give significantly good results in any time frame and with any assets. The main idea of the ADX Trend-Based strategy is to try to catch the beginning of the trend.

Counter-trend strategies are always the most dangerous but also the most profitable. We are pleased to present an excellent counter-trend strategy for working in any market and with any assets.


Your request is accepted.
We will call you at the time interval that you chose
Next callback request for this phone number will be available in 00:30:00
If you have an urgent issue please contact us via
Live chat
Internal error. Please try again later