Bill Williams is the creator of some of the most popular market indicators: Awesome Oscillator, Fractals, Alligator, and Gator.

Don’t waste your time – keep track of how NFP affects the US dollar!
Data Collection Notice
We maintain a record of your data to run this website. By clicking the button, you agree to our Privacy Policy.

Beginner Forex Book
Your ultimate guide through the world of trading.
Check Your Inbox!
In our email, you will find the Forex 101 book. Just tap the button to get it!
Risk warning: ᏟᖴᎠs are complex instruments and come with a high risk of losing money rapidly due to leverage.
68.53% of retail investor accounts lose money when trading ᏟᖴᎠs with this provider.
You should consider whether you understand how ᏟᖴᎠs work and whether you can afford to take the high risk of losing your money.
2022-09-02 • Updated
Information is not investment advice
Have you ever wondered how many wonderful tools did Japanese people invent? QR codes, car navigation, instant noodles, and sushi are just some of the Japanese things we can't imagine our life without. However, if you ask a fellow trader about the most famous invention from Japan, they will answer you without a single thought. And the answer will be a "Japanese candlestick". What is so special about this element of trading that makes many people believe in the power of its signals? How can you apply them to your trading routine?
Japanese candlesticks create the structure of the candlestick chart. On this chart, a single candlestick shows the dynamics of a price during a particular period.
For example, on the weekly timeframe, a single candlestick demonstrates the market dynamics from Monday till Friday. However, if you switch to a daily timeframe, a candlestick will show you the change in the price from 0:00 till 23:59.
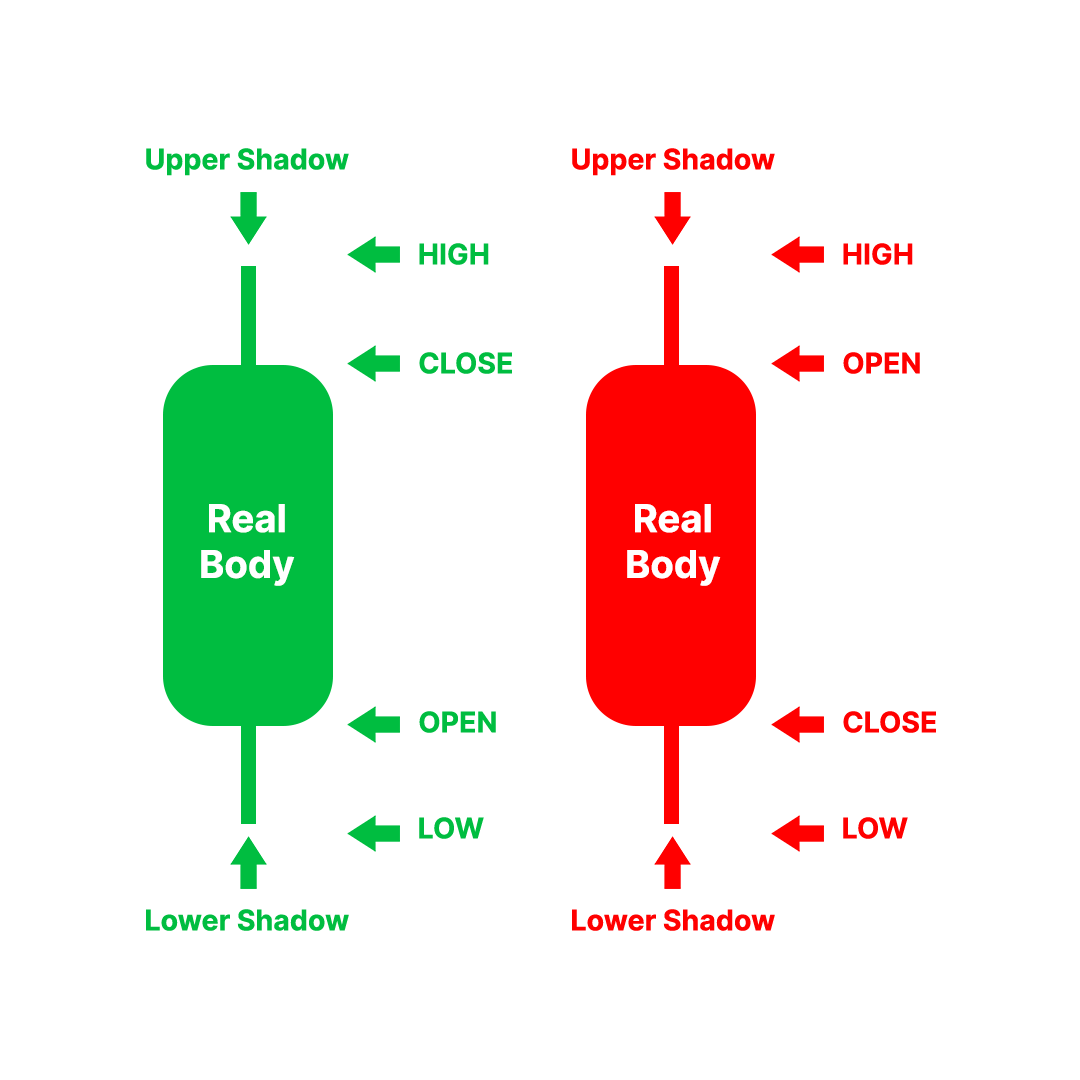
A candlestick consists of three main parts.
If the prices rose during the period, the candle is usually painted white or green. In this case, the opening price is at the bottom of the body, and the closing price is at its top. This candlestick is called bullish.
If the prices fell during the period, the candle is usually painted in black or red. In this case, the opening price is at the top of the body, and the closing price is at its bottom. This type of candlestick is named bearish.
A single candlestick is indeed helpful in understanding the price dynamics. However, they work better when they come together on a candlestick chart. What is special about this type of chart, and how does it differ from other charts? Let's find out.
A candlestick chart is similar to the bar one. Both of them show the performance of a price within a certain period. Like a candlestick on a weekly timeframe, a bar demonstrates how the price was moving during a week, from Monday to Friday.
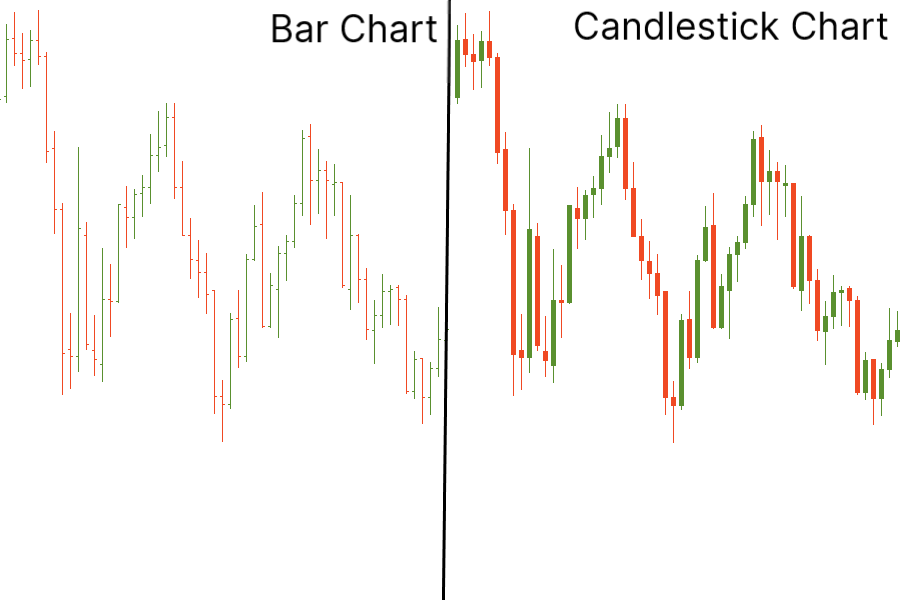
The main difference between the bar chart and its Japanese colleague lies in details. The real bodies of the candlesticks are more informative than bars. The patterns they form on the charts are more understandable visually than the lines you see on the bar chart.
Using a candlestick chart, you can read candlestick patterns that require an analysis of the candlestick's body and shadows. With long candlesticks signaling a very active session and short candlesticks hinting at a stable market, you get a quicker reaction to the changes on the chart.
There are six main types of candlesticks. Each category has its name. They are:
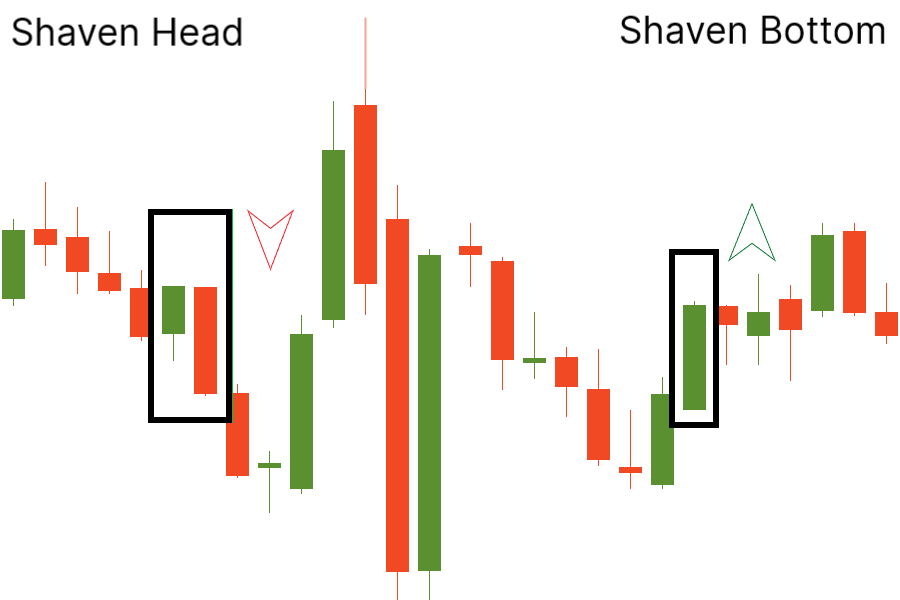
If a candlestick has no upper shadow, traders call it a "shaven head" candlestick. It usually shows that bearish pressures prevail in the market.
Alternatively, a candlestick without a lower shadow is known as "shaven bottom". This type of candlestick demonstrates that buyers dominate the market.
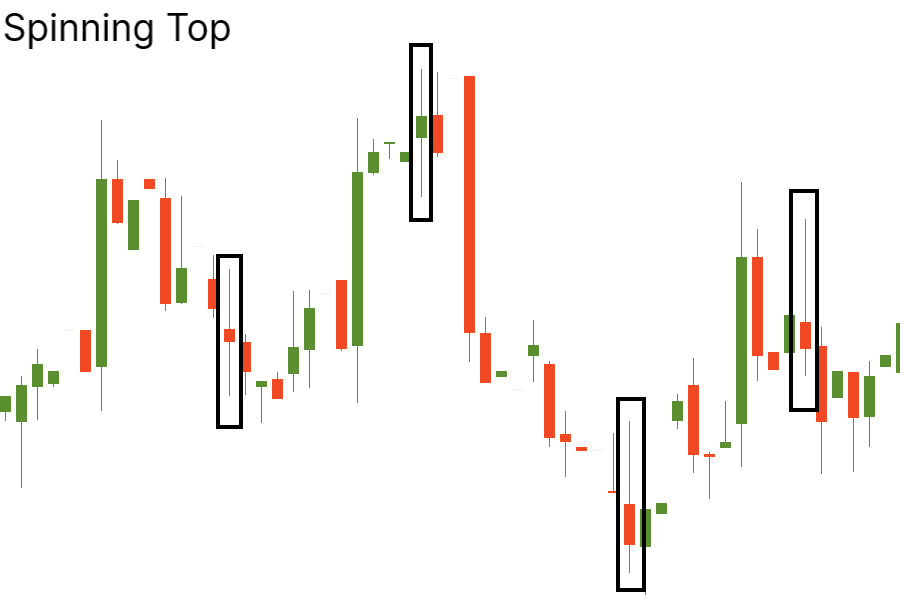
When a candlestick has a small real body and long upper and lower shadows, it is called a "spinning top". Spinning tops are the signs of the market’s indecision: both bulls and bears were active, but neither took over the market.
After a long advance or long bullish candlestick, a spinning top indicates weakness among buyers and a potential change or interruption in trend. After a long decline or a long bearish candlestick, a spinning top indicates weakness among sellers and a possible change or interruption in direction.
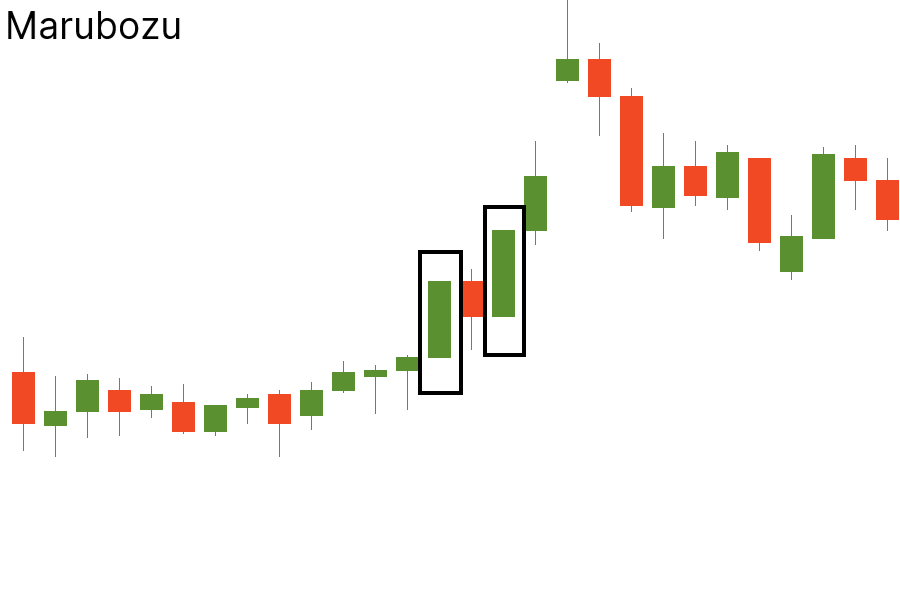
Now imagine that a candlestick has a very thick body and no upper or lower shadows. This candlestick has a very Japanese name – Marubozu.
A bullish Marubozu is formed when the opening price equals the minimum price, and the closing price equals the maximum. It shows that buyers controlled the price action during the entire period.
A bearish Marubozu is formed when the opening price equals the maximum price and the closing equals the minimum price. It shows that the price action was controlled by sellers.
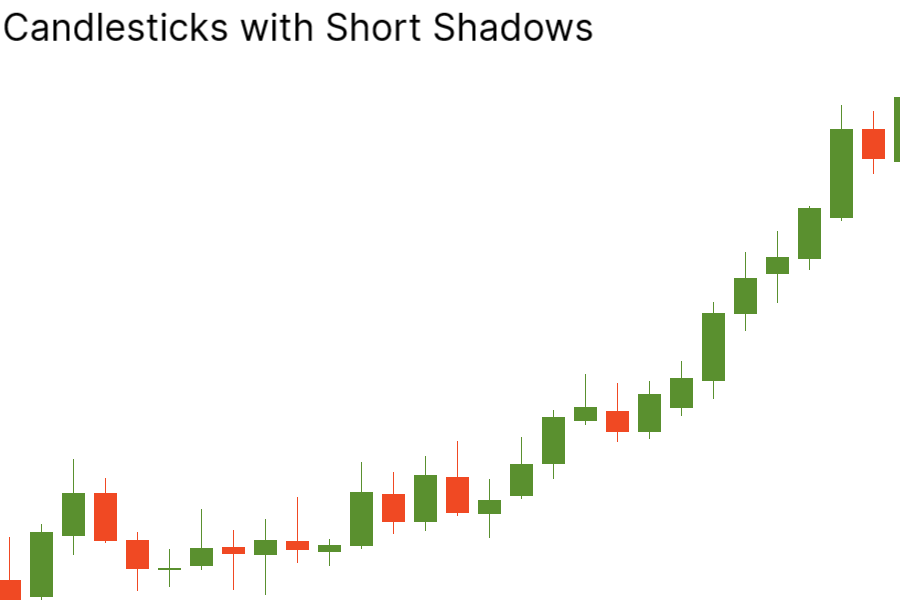
One of the most common candlestick types is a candlestick with short shadows. Candlesticks with short shadows indicate that most trading action was confined near the open and close.
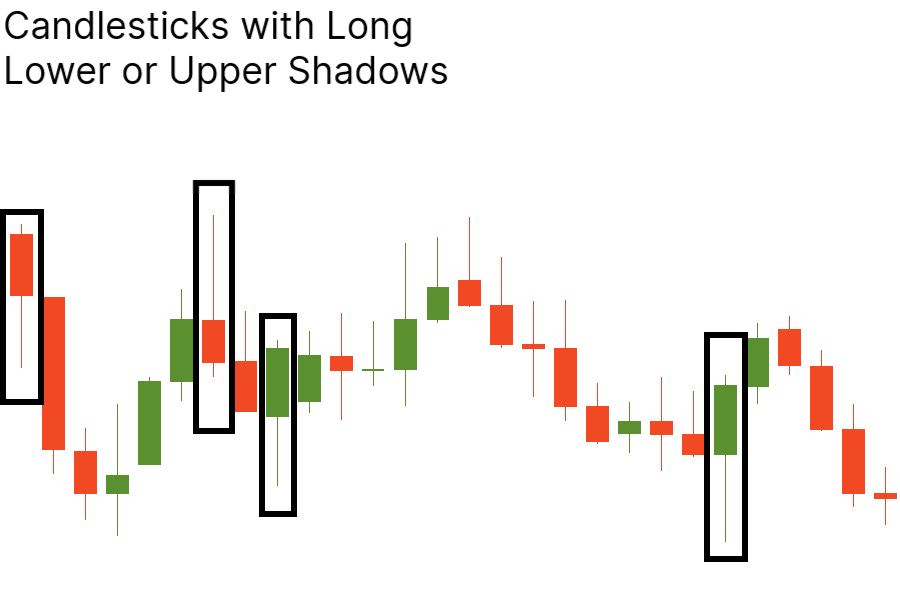
Candlesticks with a long upper shadow and short lower shadow indicate that buyers dominated during the session, but by the end of the period sellers managed to pull prices down from their highs. Vice versa, a candlestick with a long lower shadow shows that sellers dominated during the session, but the price managed to close higher.
A candlestick with an ultra-small real body (open and close prices are almost equal) is called "doji". If this candlestick is formed, neither bulls nor bears dominate in the market. The market is uncertain. The doji candlestick is a tricky one. On its own, it does not tell us much. However, it can become a significant indicator of reversal if certain conditions in the market are implemented.
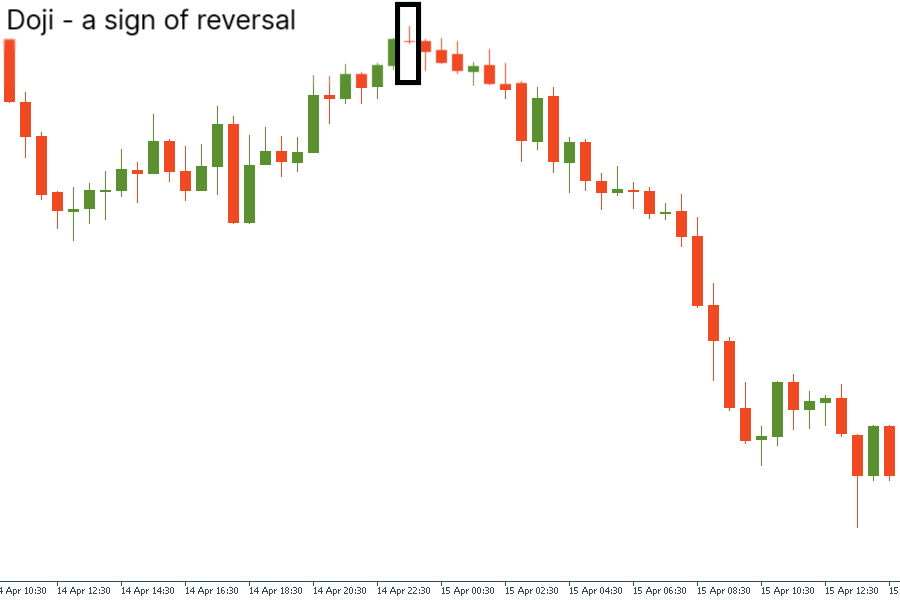
In general, a doji candlestick becomes a reversal candlestick when the following conditions are met.
Traders identify four types of doji. Let’s look at them on the picture below.
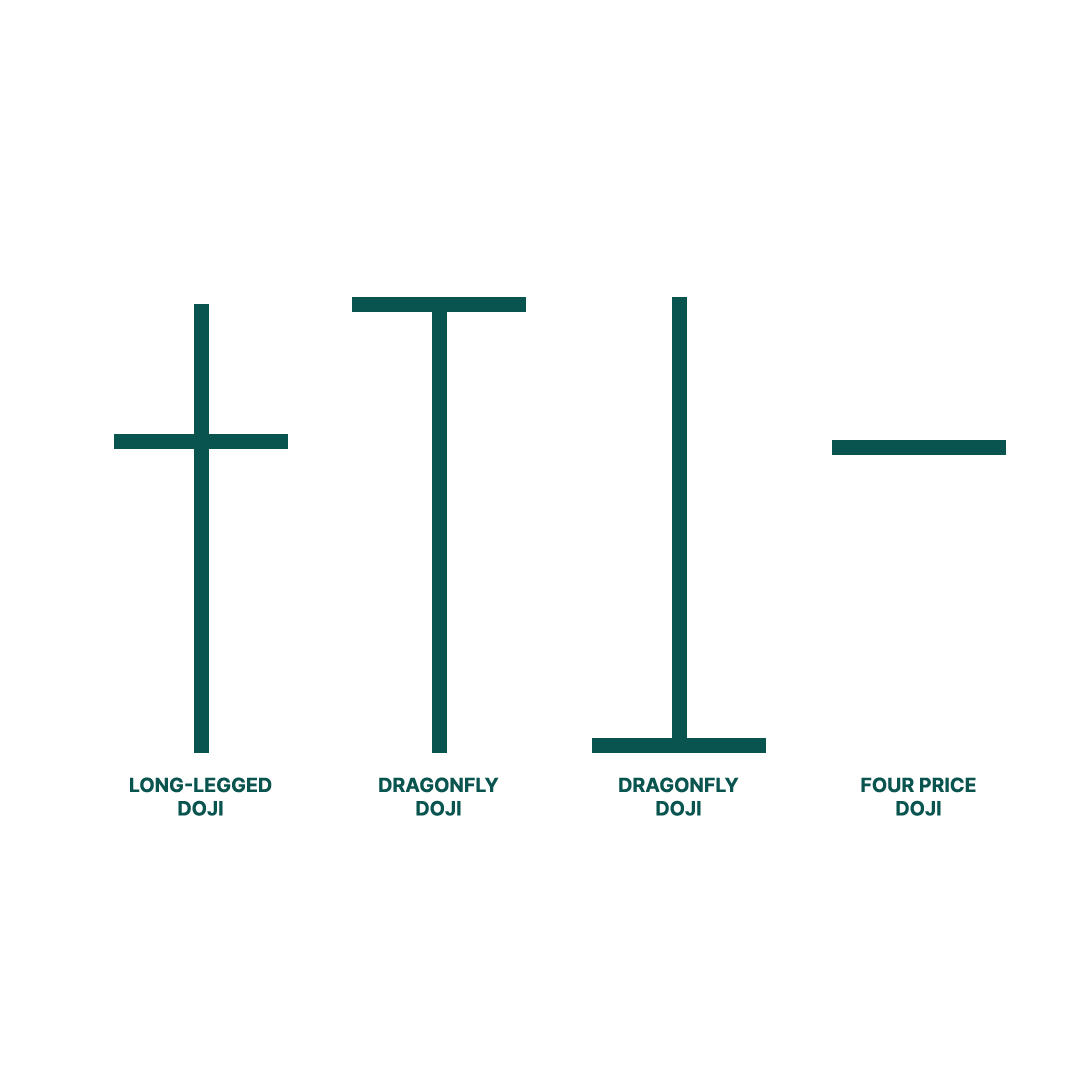
Long-legged doji has long upper and lower shadows that are almost equal in length and reflect a significant amount of indecision in the market.
Dragonfly doji is a significant bullish reversal pattern that mainly occurs at the end of downtrends.
Gravestone doji is a significant bearish reversal pattern that mainly occurs at the top of uptrends.
Four price doji is very rare and represents complete and total uncertainty by traders concerning the market direction.
The doji candlesticks can provide even more relevant information if they are part of the candlestick patterns. Japanese traders defined many different types of candlestick patterns that helped them predict further market movements.
There are a lot of candlestick patterns that you can find on a chart. Some of them are so specific that chances to meet them in your everyday routine are really low. Others are familiar even to those who don't trade a lot. So let's find out if you know the top five reversal candlestick patterns!
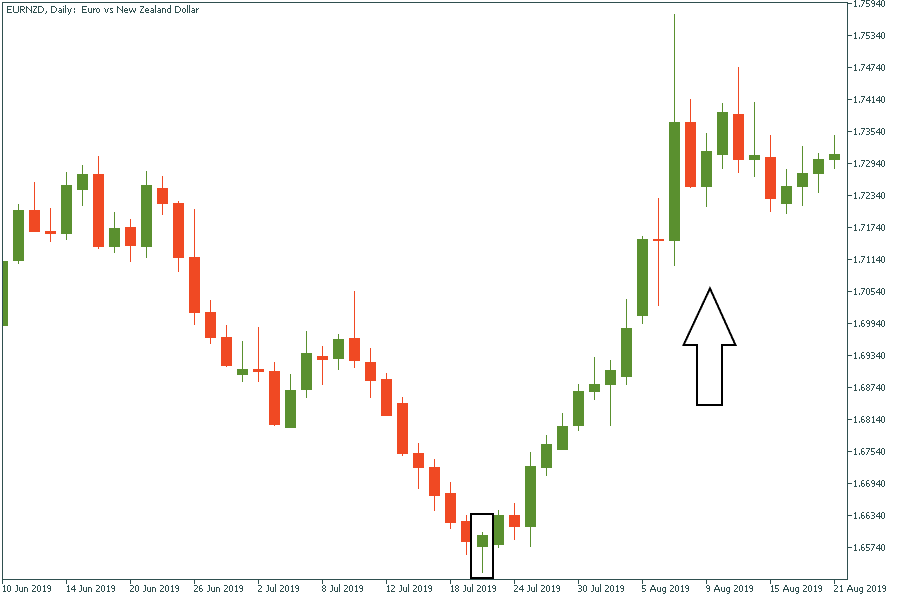
Hammer is a single-candlestick pattern that signals the reversal to the upside. The candlestick should appear at the end of a downtrend. This candlestick has a short body, a short upper shadow, and a long lower shadow. The lower shadow should be twice the length of the real body. Hammers show that although bears were able to pull the price to a new low, they failed to hold it there and lost a battle with buyers by the end of a trading period.
On the chart of EUR/NZD, we can see a clear example of a hammer. After a downtrend, a bullish candlestick with a long lower shadow appeared. The next candlestick after the hammer was bullish. It closed above the opening price of the hammer. Thus, the reversal gets a confirmation.
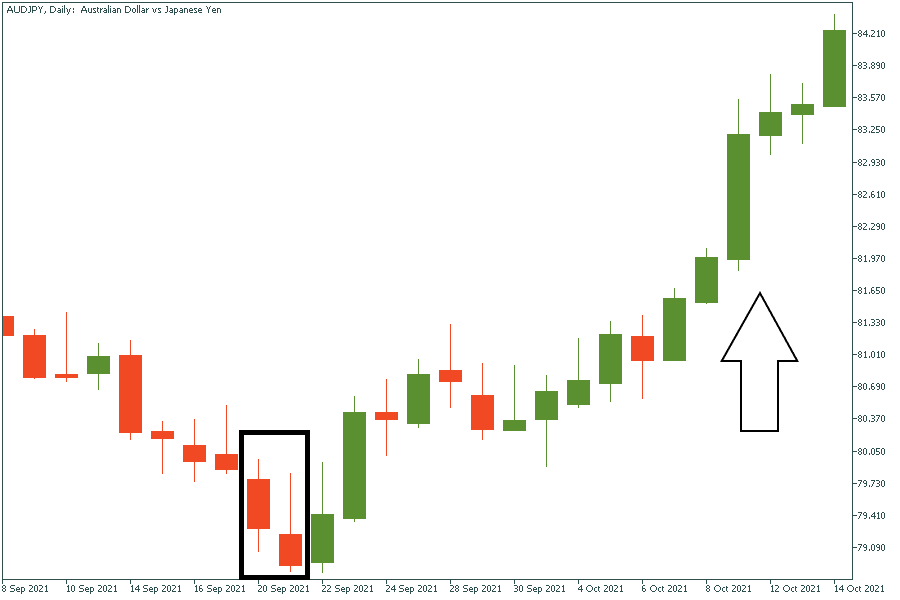
This is the hammer pattern turned upside down. However, apart from the hammer, this setup requires two candlesticks to be confirmed; the first of them should be bearish. Its signal is more reliable when the candlestick after the pattern is bullish. The pattern needs confirmation as a breakout of the nearest resistance zone or a trend line.
On the chart of AUD/JPY, after a bearish candlestick in a downtrend, an inversed hammer appeared. The bullish candlestick confirmed the upside momentum after it. Indeed, the trend reversed.
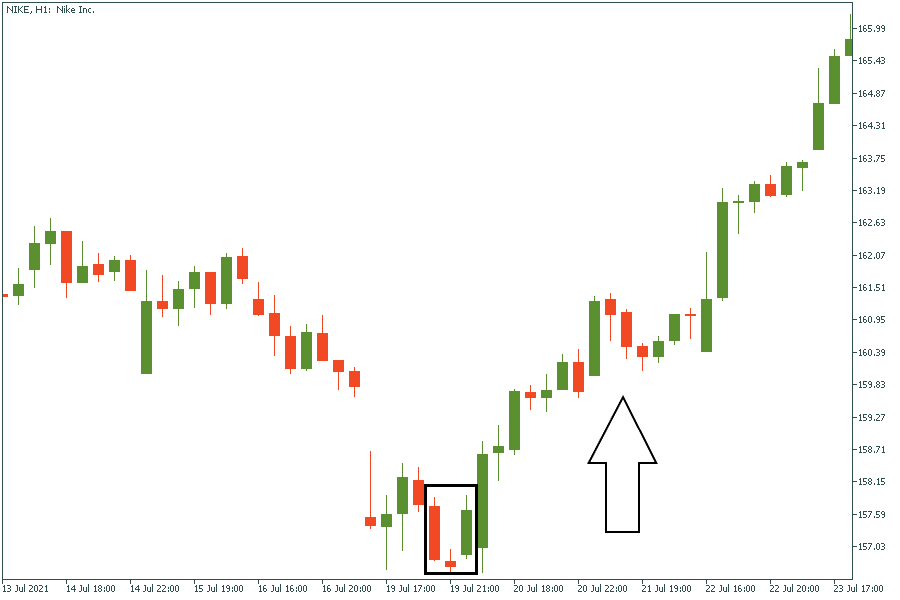
The “morning star” is the nickname for the planet Mercury. If you look at the sky and see it, the sunrise will start soon. With prices, it is the same: when the morning star appears, the price will go up.
The first candlestick of the pattern should be bearish, with a big real body. The second candlestick should open with a gap down (below the body of the first candlestick) and has a small real body. It shows that sellers get weaker. The color of this candlestick doesn't matter. The third candlestick should fill in the last bearish gap. It should be bullish and close above the middle of the first candlestick.
In the picture, you can see how the morning star on the chart of Nike’s stock caused the creation of an uptrend.
Contrary to the bullish reversal patterns, there are bearish reversal patterns. They appear at the end of an uptrend and signal the reversal to the downside. Let’s look at the two most famous of them.
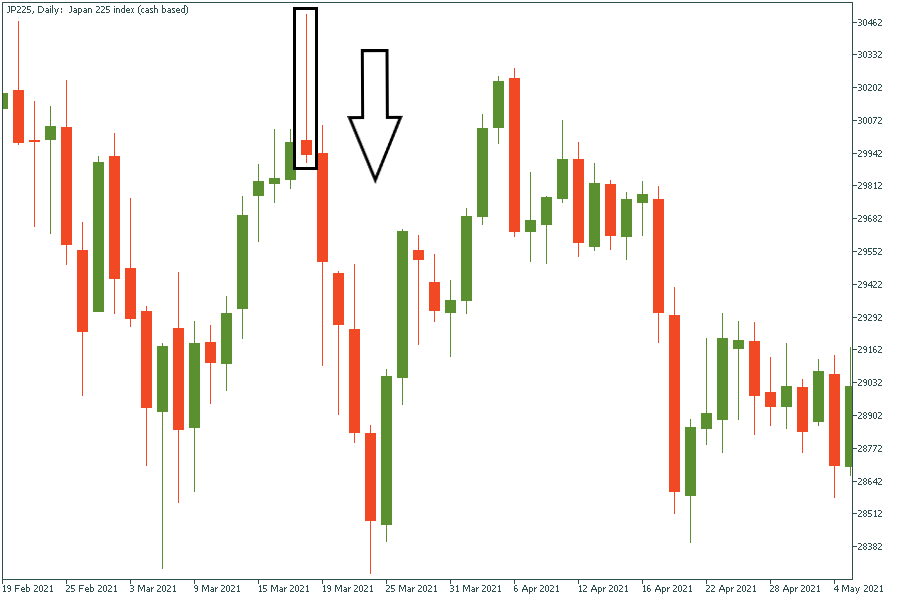
This is one of the most noticeable reversal candlestick patterns during an uptrend. When you see it, don't forget to make a wish for a sell signal! The long upper shadow shows that market participants no longer accept the price. Therefore, the real body of this pattern should be small, as well as the lower shadow.
On the chart of JP225, a shooting star after an uptrend showed the change of a trend’s direction.
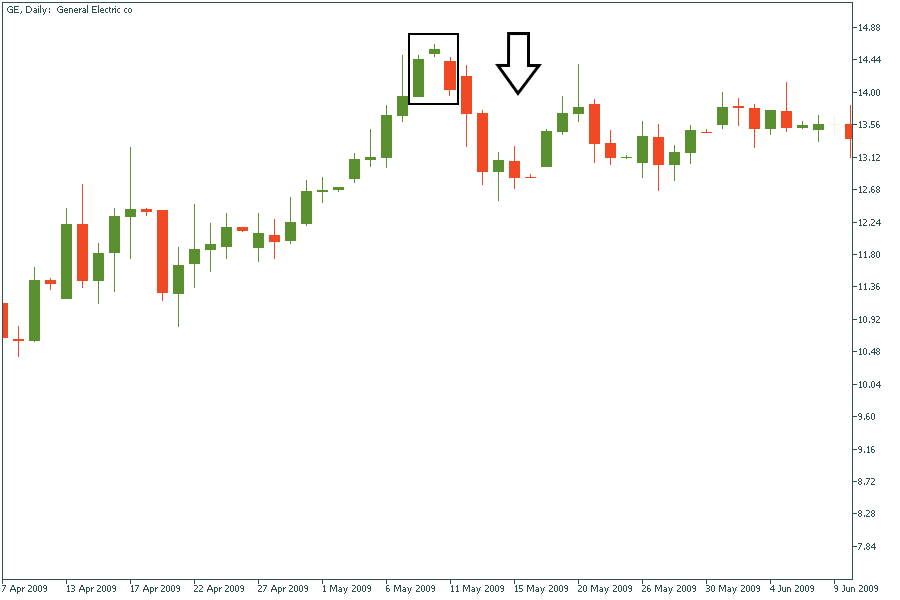
This pattern consists of three candlesticks. The first candlestick is bullish, the color of the second one is not important, and the third candlestick is bearish. The first candlestick is long, the second has a small real body, and the third is longer than the first one. There is a gap up between the first and the second candlesticks. The third candlestick fills in the bullish gap.
On the daily chart of GE, you can find the evening chart pattern.
Now you know all the essential information regarding candlestick patterns! We hope that with the knowledge you received, you will conquer the markets soon! To learn more about the Japanese candles, visit the FBS Guidebook.

Bill Williams is the creator of some of the most popular market indicators: Awesome Oscillator, Fractals, Alligator, and Gator.
Trend strategies are good - they may give significantly good results in any time frame and with any assets. The main idea of the ADX Trend-Based strategy is to try to catch the beginning of the trend.

Counter-trend strategies are always the most dangerous but also the most profitable. We are pleased to present an excellent counter-trend strategy for working in any market and with any assets.
Your request is accepted.
We will call you at the time interval that you chose
Next callback request for this phone number will be available in 00:30:00
If you have an urgent issue please contact us via
Live chat
Internal error. Please try again later