


Williams’ Strategy
Bill Williams is the creator of some of the most popular market indicators: Awesome Oscillator, Fractals, Alligator, and Gator.

Don’t waste your time – keep track of how NFP affects the US dollar!
Data Collection Notice
We maintain a record of your data to run this website. By clicking the button, you agree to our Privacy Policy.

Beginner Forex Book
Your ultimate guide through the world of trading.

Check Your Inbox!
In our email, you will find the Forex 101 book. Just tap the button to get it!
Risk warning: ᏟᖴᎠs are complex instruments and come with a high risk of losing money rapidly due to leverage.
70.72% of retail investor accounts lose money when trading ᏟᖴᎠs with this provider.
You should consider whether you understand how ᏟᖴᎠs work and whether you can afford to take the high risk of losing your money.
Warning! Old version of the browser!
Press one of the icons below to proceed to the official website of the developer and download the latest version of your browser.

Online Forex broker
2022-11-22 • Updated
Information is not investment advice
Doji candles are rare birds, but if you catch them, it can be a great chance to seize the right entry moment. This article will discuss what a Doji candle is. You will also get a Doji strategy that can bring profit.
The Doji candlestick, or Doji star, is characterized by its "cross" shape. This happens when a Forex pair or any other trading instrument opens and closes at the same level, leaving a small or non-existent body while showing the same length upper and lower wicks.
A Doji candlestick pattern occurs when the market’s open and close prices are nearly the same. This may happen when the market opens and bull traders push prices up, while bear traders reject the higher price and pull it down. It could also be that bearish traders are trying to get prices as low as possible, while bulls are resisting and pushing the price up. The up and down movements, that occur between opening and closing, form the wicks. As a result, the body is flat or, as they say, the candlestick has no body.
Typically, a Doji represents indecision in the market, but it can also be a sign of slowing momentum in an existing trend.
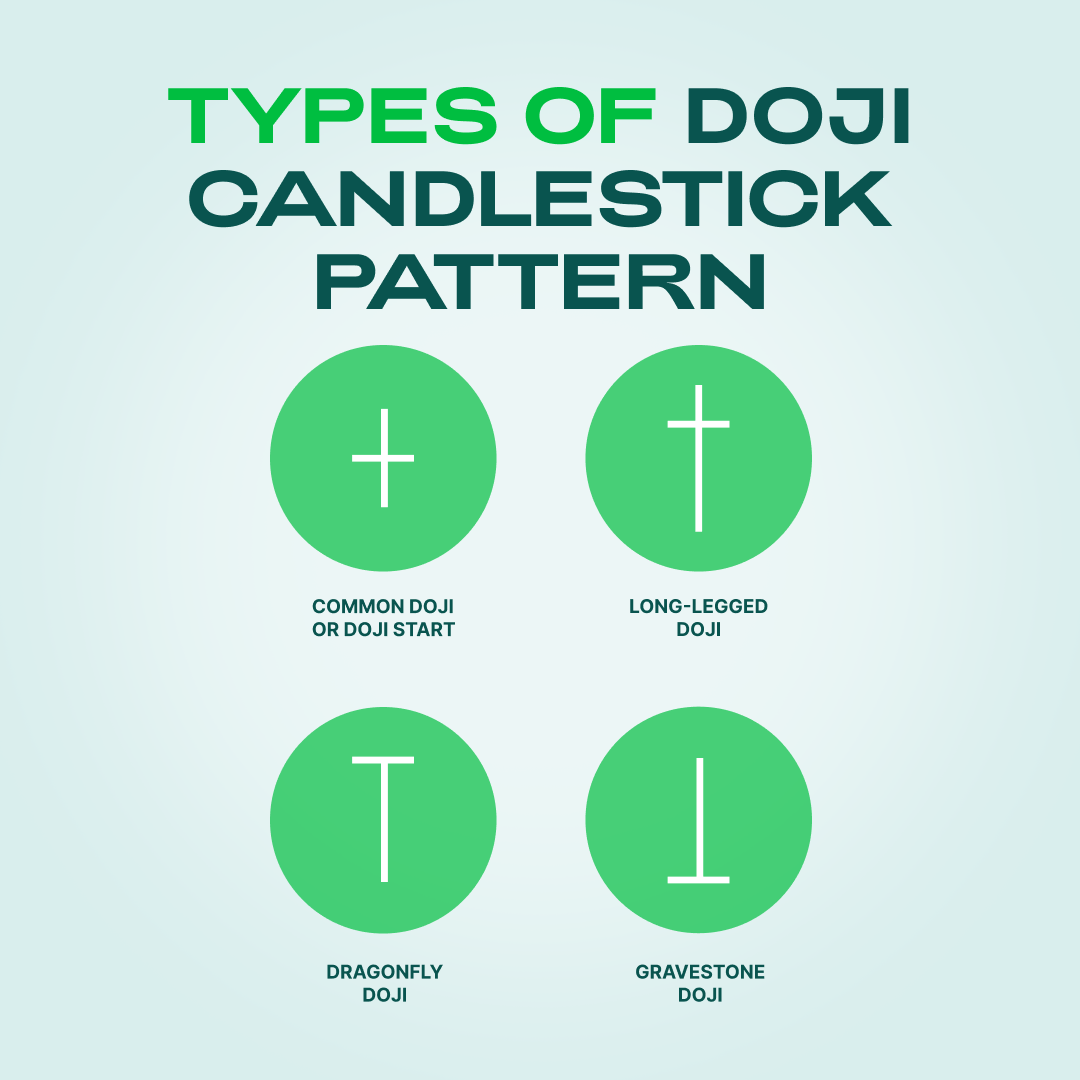
This is the most common type of Doji candlestick pattern. When buying and selling are almost the same, this pattern occurs. The future direction of the trend is uncertain as indicated by this Doji pattern. The common Doji is a standalone candlestick that doesn't mean much on its own. To understand what this candlestick means, traders watch the previous price action.
The long-legged Doji has longer vertical lines above and below the horizontal line. This indicates that during the period of the candle, the price moved sharply up and down, but closed at almost the same level as it opened. It shows indecision between buyers and sellers and is more dramatic than the common doji.
The Gravestone Doji is the opposite of the Dragonfly Doji. It appears when price action opens and closes at the bottom of a trading range. After the candle opening, buyers were able to push the price higher, but by the close, they were unable to maintain the bullish momentum. At the top of an up move, this is a bearish signal.
A dragonfly Doji can appear either at the top of an uptrend or the bottom of a downtrend and signals the possibility of a change in direction. There’s no line above the horizontal bar, which creates a "T" shape and indicates that prices haven’t risen above the opening price. A strongly extended lower wick of this Doji at the bottom of a bearish move is a very bullish signal.
The Doji star can prove invaluable as it gives Forex traders a "pause and reflection” moment. If the market moves higher when a Doji pattern appears, this can be a sign that the buying momentum slows down or the selling momentum is starting to pick up. Traders may see this as a sign to get out of an existing long trade.
However, it’s important to consider this candle formation together with a technical indicator or your specific exit strategy. Traders should only exit such trades if they’re confident that the indicator or exit strategy confirms what Doji is suggesting.
Remember, it’s possible that the market was hesitant for a short period of time and then continued moving in the direction of the trend. Therefore, it’s extremely important to conduct a thorough analysis before closing a position.
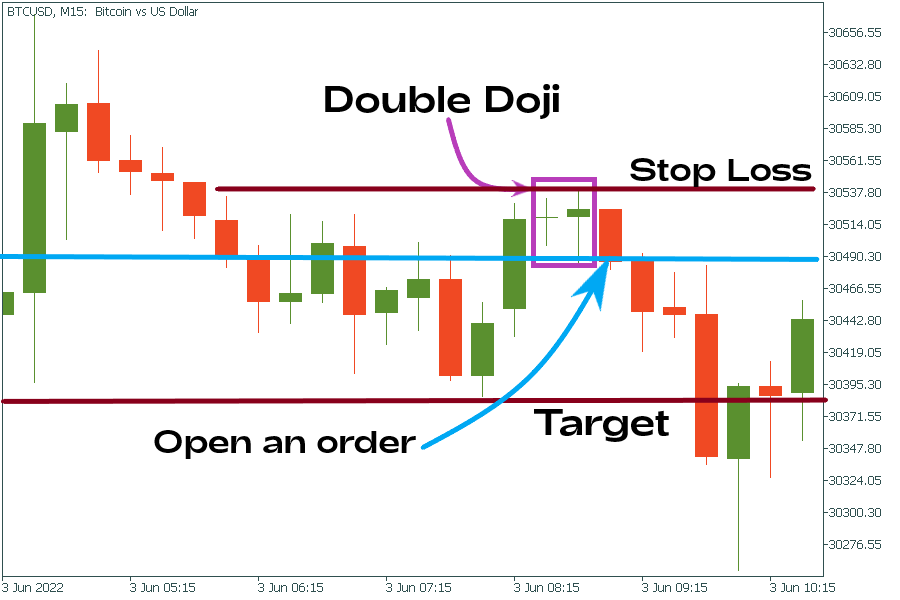
One Doji is usually a good sign of indecision, however, two Dojis in a row represent an even bigger sign that often results in a strong breakout. The Double Doji strategy seems to use a strong directional move that is reversed after a period of indecision. Traders can wait until the market goes up or down immediately after the Double Doji.
On the BTCUSD chart below, the entry could be below the two Doji lows and the Stop Loss above the two Doji highs. Targets can be at the recent support level.
Candlestick patterns like Dojis can be very informative if traders want to understand the market better. However, Doji candles work best when used together with other technical tools and the trend.
In general, the more complex and sophisticated your Doji trading strategy is, the more likely you are to make informed trading decisions. Just make sure you test what you're doing if you don't want to end up in a situation where your account balance is damaged.

Bill Williams is the creator of some of the most popular market indicators: Awesome Oscillator, Fractals, Alligator, and Gator.

Trend strategies are good - they may give significantly good results in any time frame and with any assets. The main idea of the ADX Trend-Based strategy is to try to catch the beginning of the trend.

Counter-trend strategies are always the most dangerous but also the most profitable. We are pleased to present an excellent counter-trend strategy for working in any market and with any assets.


Your request is accepted.
We will call you at the time interval that you chose
Next callback request for this phone number will be available in 00:30:00
If you have an urgent issue please contact us via
Live chat
Internal error. Please try again later