


Williams’ Strategy
Bill Williams is the creator of some of the most popular market indicators: Awesome Oscillator, Fractals, Alligator, and Gator.

Don’t waste your time – keep track of how NFP affects the US dollar!
Data Collection Notice
We maintain a record of your data to run this website. By clicking the button, you agree to our Privacy Policy.

Beginner Forex Book
Your ultimate guide through the world of trading.

Check Your Inbox!
In our email, you will find the Forex 101 book. Just tap the button to get it!
Risk warning: CFDs are complex instruments and come with a high risk of losing money rapidly due to leverage.
66.43% of retail investor accounts lose money when trading CFDs with this provider.
You should consider whether you understand how CFDs work and whether you can afford to take the high risk of losing your money.
Warning! Old version of the browser!
Press one of the icons below to proceed to the official website of the developer and download the latest version of your browser.

Online Forex broker
2022-05-12 • Updated
Information is not investment advice
The Cypher pattern isn’t the most famous trading formation. Nevertheless, this trading instrument can help you better understand and forecast the price moves. Learn how it works and add it to your trading toolkit.
The Cypher pattern is a reversal formation within the harmonic class of patterns. It occurs across various financial markets including Forex, futures, stocks, and crypto. The cypher pattern consists of four separate price segments, with defined Fibonacci relationships.
In an uptrend, the Cypher pattern makes higher highs and higher lows. Vice versa, in a downtrend, the Cypher pattern makes lower lows and lower highs.
Another attractive characteristic of the Cypher pattern is that the first three legs within the formation resemble a zigzag or lightning bolt.
Below you can see an example of the bullish Cypher pattern.
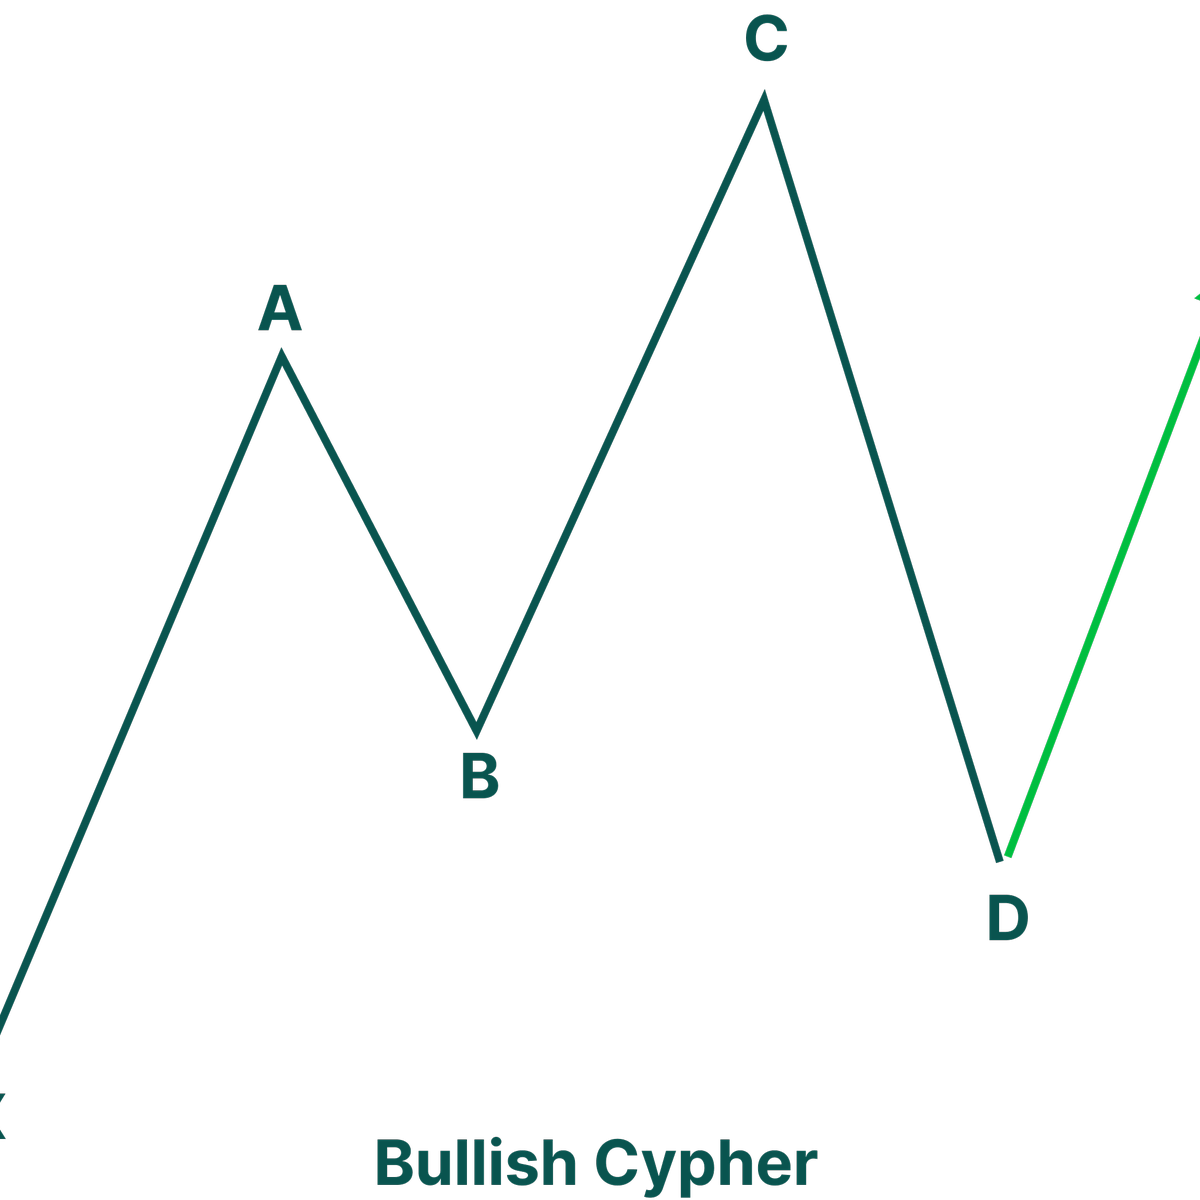
You can notice that the pattern is a five-point XABCD structure, which consists of four individual segments. In bullish formation, the A point and the C point make higher highs, and the B point makes a higher low.
There are some rules for classifying a valid Cypher pattern. The XA segment should always be impulsive. The AB segment, a corrective movement, retraces a portion of the XA segment. The BC segment continues the movement of the first (XA) segment and forms a higher high. Finally, the CD segment retraces a large portion of the entire movement between points X and C.
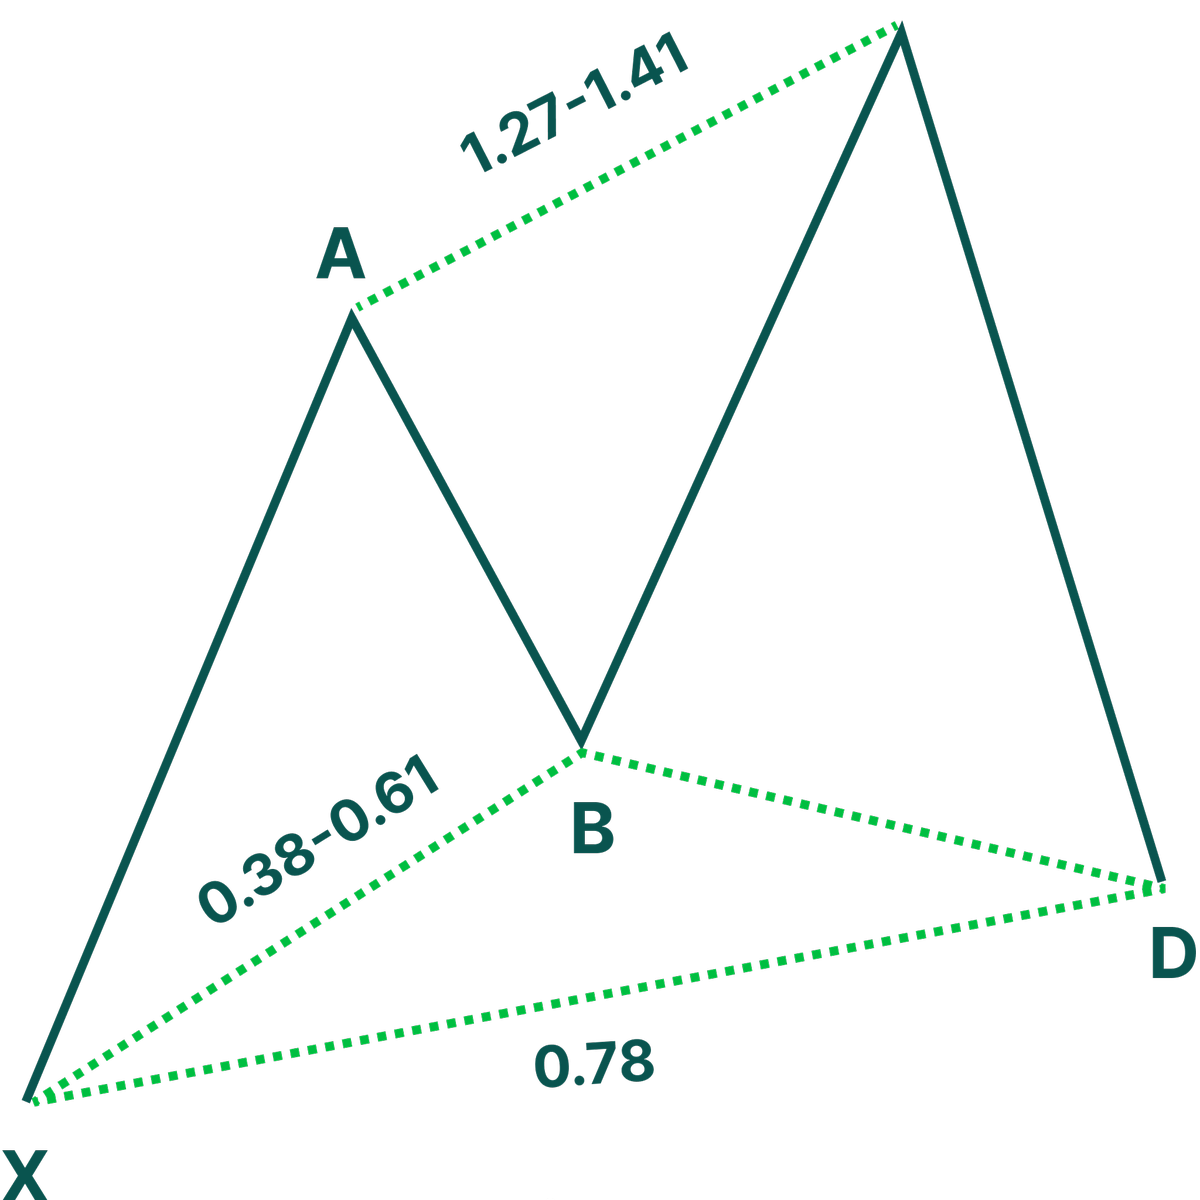
Traders use two primary Fibonacci tools to define the Cypher pattern. The first is the Fibonacci retracement, and the second is the Fibonacci projection.
The AB segment must retrace the XA segment by at least 38.2%, and it should not exceed 61.8%.
The C point within the structure should be a minimum 127% projection of the XA segment, measured from point B. At the same time, the C point should not extend beyond the 141.4% level.
Point D should terminate at or near the 78.6% Fibonacci retracement level of the price move as measured from the start at point X to point C.
The first and last are the most important rules for the Cypher pattern.
If the shadow of the candlestick appears inordinately large, then it will be better to use the candle close for measuring. On the other hand, if the shadow is of standard size, it’s better to use it in the measuring process.
We can prepare for a potential trade near the Cypher’s completion point when we find the trading pattern with the proper Fibonacci relationships.
A trader should follow the following trading strategy to open a long position upon detecting a bullish Cypher trading pattern:
It’s better to use a two-tiered Take Profit target strategy. A trader should set the first target below the A point and the second target below the C point.
On the other hand, a trader should follow the following steps to open a short position within the bearish Cypher trading pattern:
A trader should set the first target just above the A point and the second just above the C point swing low.
The image below represents the typical bullish Cypher pattern.
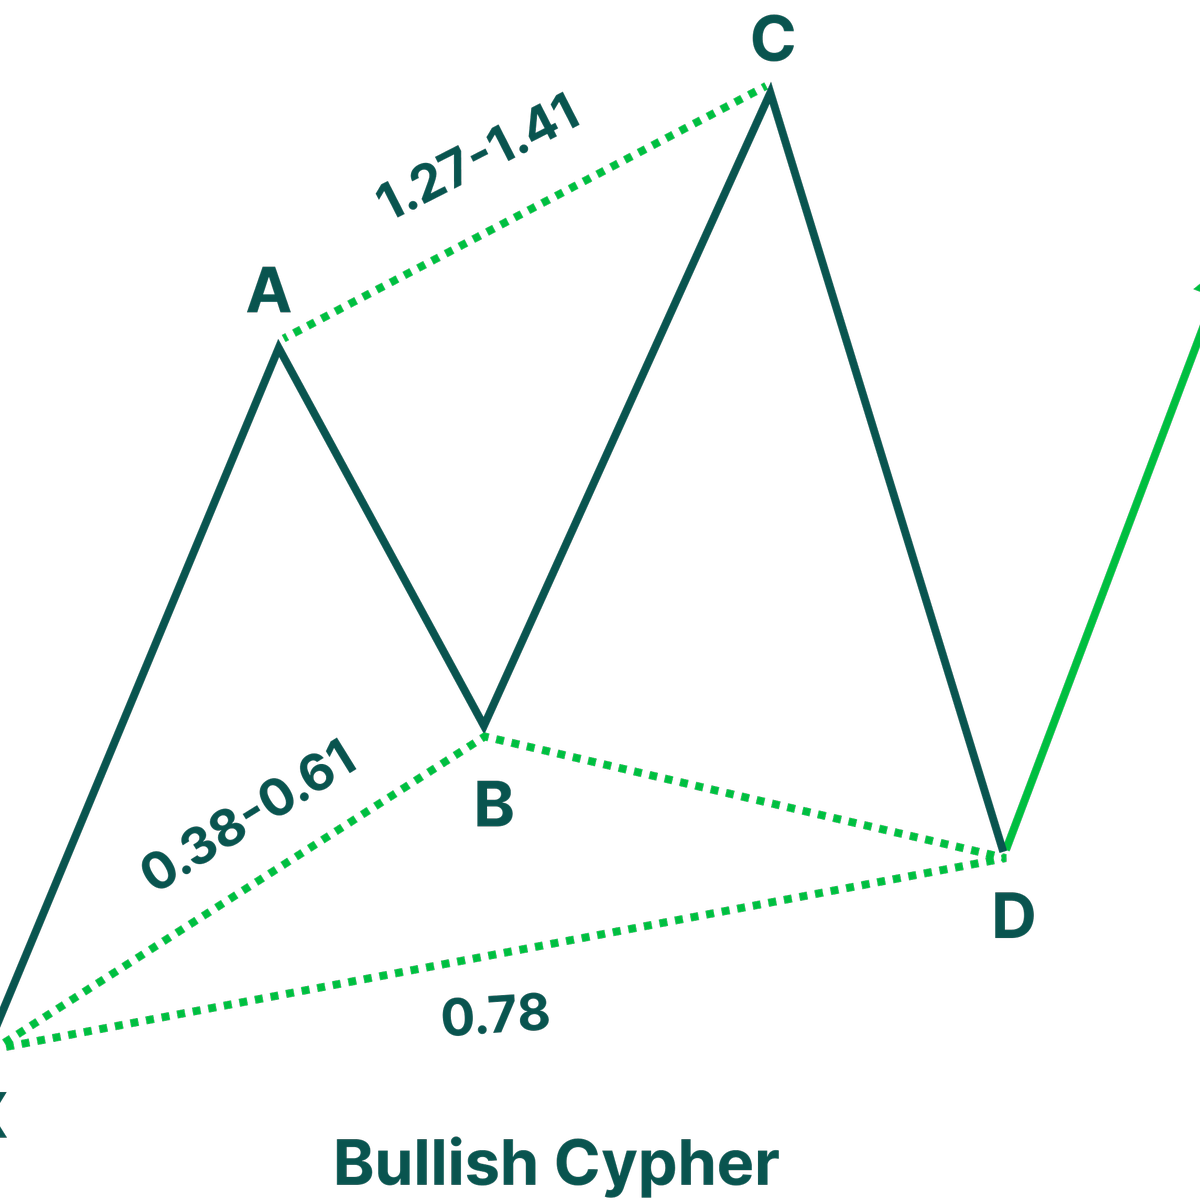
The initial XA segment forms from the starting point at X.
The AB moves lower to retrace the XA. This retracement should bring prices between the 38.2 to 61.8 level of the XA segment.
The BC segment forms a higher high and terminates between the 127.2 and 141.4 projection of the initial XA segment.
The CD segment moves lower and terminates near the 78.6% retracement level of the price movement from point X to point C.
As soon as the price reaches the 78.6% retracement level at point D, the bullish Cypher pattern is considered valid, and a further price increase is expected.
You need to follow the several steps to draw a Cypher pattern.
The Cypher pattern is one of the most advanced harmonic structures. However, this pattern has a high probability of success and offers a solid risk to reward ratio.
As well as many other patterns, the Cypher pattern works better when on higher time frames such as the four-hour and above.

Bill Williams is the creator of some of the most popular market indicators: Awesome Oscillator, Fractals, Alligator, and Gator.

Trend strategies are good - they may give significantly good results in any time frame and with any assets. The main idea of the ADX Trend-Based strategy is to try to catch the beginning of the trend.

Counter-trend strategies are always the most dangerous but also the most profitable. We are pleased to present an excellent counter-trend strategy for working in any market and with any assets.


Your request is accepted.
We will call you at the time interval that you chose
Next callback request for this phone number will be available in 00:30:00
If you have an urgent issue please contact us via
Live chat
Internal error. Please try again later