


Williams’ Strategy
Bill Williams is the creator of some of the most popular market indicators: Awesome Oscillator, Fractals, Alligator, and Gator.

Don’t waste your time – keep track of how NFP affects the US dollar!
Data Collection Notice
We maintain a record of your data to run this website. By clicking the button, you agree to our Privacy Policy.

Beginner Forex Book
Your ultimate guide through the world of trading.

Check Your Inbox!
In our email, you will find the Forex 101 book. Just tap the button to get it!
Risk warning: ᏟᖴᎠs are complex instruments and come with a high risk of losing money rapidly due to leverage.
70.72% of retail investor accounts lose money when trading ᏟᖴᎠs with this provider.
You should consider whether you understand how ᏟᖴᎠs work and whether you can afford to take the high risk of losing your money.
Warning! Old version of the browser!
Press one of the icons below to proceed to the official website of the developer and download the latest version of your browser.

Online Forex broker
2022-12-20 • Updated
Information is not investment advice
Many traders use Japanese candlestick charts to analyze the price of an asset. This type of chart depicts the price action over a certain period and helps a trader check the trend's strength and predict an upcoming reversal through Japanese candlesticks’ analysis. Japanese candlesticks (parts of the Japanese candlestick chart) are very informative technical analysis instruments. They form continuation and reversal patterns, which traders follow. Even a single candlestick can tell a lot about the price changes. This article will introduce you to one of the most famous single-candlestick patterns – a hammer candlestick pattern. To identify the Hammer candlestick pattern, a trader needs to open the trading platform and find it on the chart.
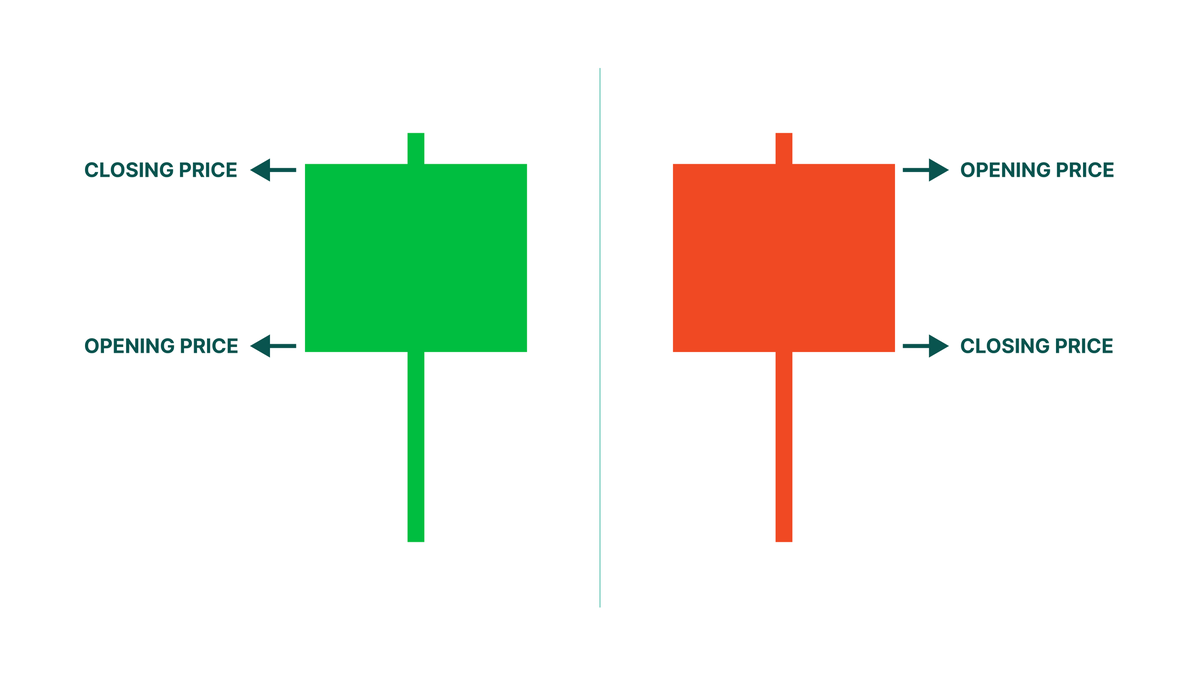
The Hammer candlestick is a pattern that appears at the end of a downtrend. It consists of a small real body and a long lower shadow. The shadow should be at least twice the size of the body. A small real body means a small range between the opening and closing prices. A long lower tale indicates that bears tried to pull the price to the fresh lows but failed to continue the downtrend. The pattern's color can be either bullish or bearish, although the signal is more substantial if it's bullish.
The picture below shows bullish and bearish examples of this pattern.
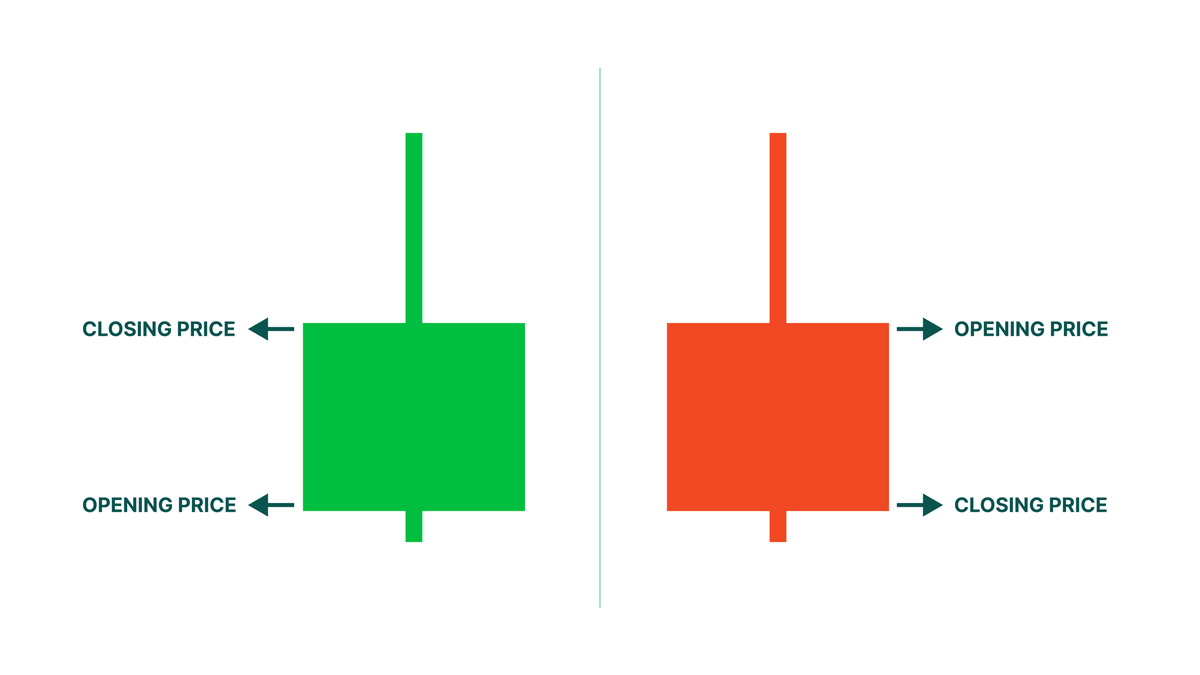
There is also an Inverted Hammer candlestick pattern, which looks like a reversed Hammer. Apart from the regular Hammer candle, it consists of a small regular body and an upper shadow (tale) at least twice bigger than the body. The formation of the pattern signals the start of an uptrend as well.
In the picture below, you can see bullish and bearish Inverted Hammers.
Hammers can appear on any timeframes and the charts of any instruments: stocks, Forex, metals, crypto, etc.
When the price moves in a downtrend and reaches a significant and strong support level, you must be extremely careful and prepare for a potential reversal. If the price moves significantly below the candle's opening price but quickly recovers, it forms the Hammer chart candlestick pattern. The pattern is recommended to be bullish or confirmed by the following bullish candlestick. A Buy Stop order should be placed at the opening price of the next candlestick after the confirmation. A protective Stop Loss should be placed below the Hammer's low or at the opening (for bullish) or closing (for bearish) price of the candle’s real body. The signal is stronger on the higher timeframe.
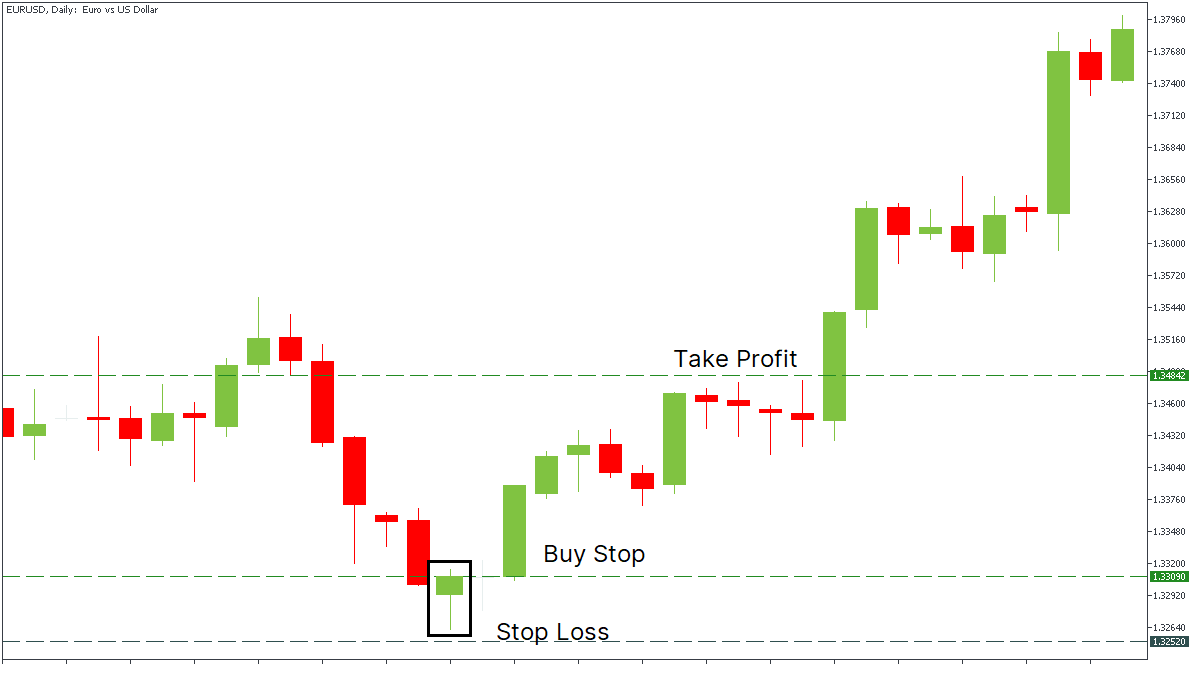
The picture above shows an example of placing a Buy Stop order with a Stop Loss and Take Profit after the Hammer Pattern appeared during the downtrend. We placed Stop Loss below the low of the pattern. Take Profit was set at a distance three times bigger than the one between the SL level and Buy Stop.
The Hammer Candlestick pattern signals that sellers get weaker. The candlestick's wick demonstrates that the attempt to lower the price was unsuccessful, and the reversal may be on the way. As with any candlestick pattern, the Hammer Candlestick requires confirmation.
As mentioned in the previous paragraphs, the appearance of the Hammer Candlestick on the chart itself does not predict the reversal. Also, there is no evidence that the price will continue forming an uptrend after the confirmation candle. If the momentum is strong with a long-shadowed hammer and big confirmation candle, the price may become too high from its stop loss level, which is risky.
It's also quite hard to set the price target with hammers. Therefore, exits should be based on other analytical insights: key levels or other candlestick patterns.
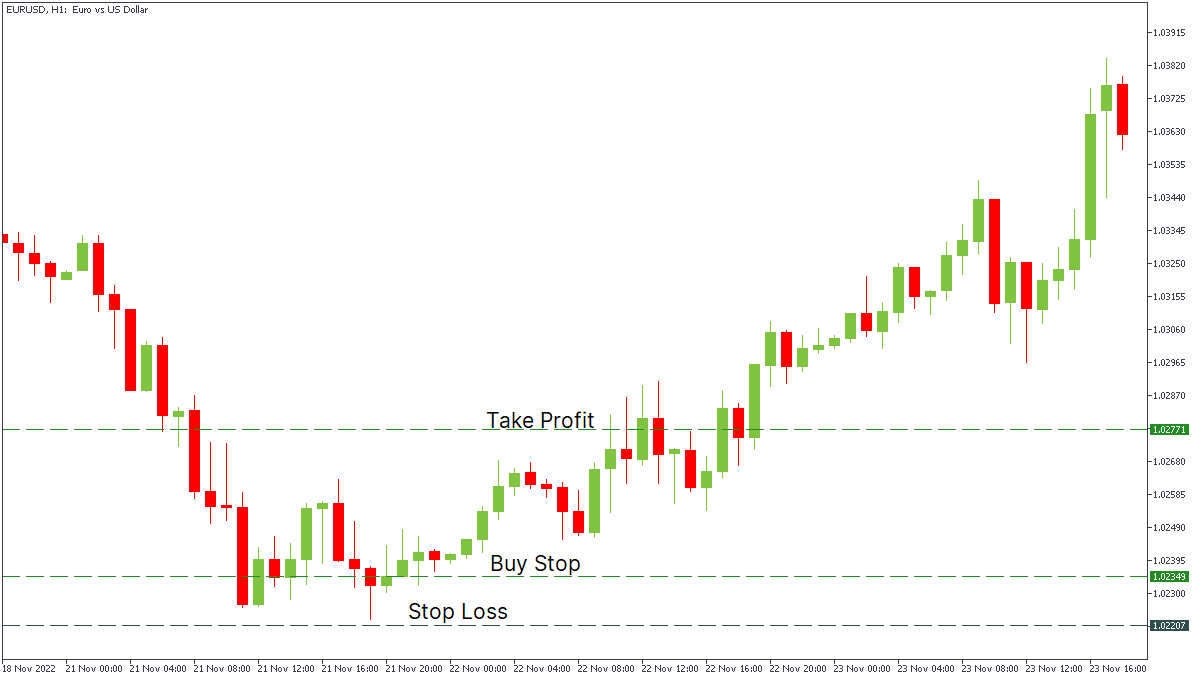
Traders can use the Hammer candlestick pattern as an additional tool for analyzing the market performance or as a part of their trading strategy. If a trader follows the intraday opportunities on smaller timeframes (H1), a Hammer pattern near the daily support may help identify a Buy entry. You can find an example of the entry at significant support in the picture below.
On bigger timeframes (such as weekly), the Hammer candlestick demonstrates a prolonged trend change.
Apart from the Hammer candlestick, a Doji has a tiny body or no body at all. This type of candlestick shows market indecision when neither bulls nor bears dominate. A single Doji is neutral, but if it appears after a series of bullish candles with long bodies, it signals that buyers are becoming weak, and the price may reverse to the downside. Alternatively, if Doji forms after a series of bearish candles with long bodies, sellers are losing their strength, and the price may rise. The Hammer candlestick, in its turn, has a unique shape. If it appears during the downtrend, it signals the reversal to the upside.
A Hammer candlestick provides a bullish signal to the price. The color of a Hammer candlestick may be either bullish or bearish.
Although Shooting Star looks precisely similar to the Inverted Hammer, it appears at the end of an ascending trend. The Hammer pattern is a one-candlestick pattern that appears during the downtrend and indicates the reversal to the upside. There is also an inverted candlestick pattern with a long upper shadow, which marks an uptrend's start. The long upper shadow implies that the market tried to find where resistance and support were located, but bears rejected the upside.
The Hammer candlestick patterns are recognizable and relatively easy elements of candlestick chart analysis. While it may indicate a change in the trend, it requires confirmation. Thus, it's not recommended to follow the signals blindly.

Bill Williams is the creator of some of the most popular market indicators: Awesome Oscillator, Fractals, Alligator, and Gator.

Trend strategies are good - they may give significantly good results in any time frame and with any assets. The main idea of the ADX Trend-Based strategy is to try to catch the beginning of the trend.

Counter-trend strategies are always the most dangerous but also the most profitable. We are pleased to present an excellent counter-trend strategy for working in any market and with any assets.


Your request is accepted.
We will call you at the time interval that you chose
Next callback request for this phone number will be available in 00:30:00
If you have an urgent issue please contact us via
Live chat
Internal error. Please try again later