

Williams’ Strategy
Bill Williams is the creator of some of the most popular market indicators: Awesome Oscillator, Fractals, Alligator, and Gator.

Don’t waste your time – keep track of how NFP affects the US dollar!
Data Collection Notice
We maintain a record of your data to run this website. By clicking the button, you agree to our Privacy Policy.

Beginner Forex Book
Your ultimate guide through the world of trading.

Check Your Inbox!
In our email, you will find the Forex 101 book. Just tap the button to get it!
Risk warning: ᏟᖴᎠs are complex instruments and come with a high risk of losing money rapidly due to leverage.
70.72% of retail investor accounts lose money when trading ᏟᖴᎠs with this provider.
You should consider whether you understand how ᏟᖴᎠs work and whether you can afford to take the high risk of losing your money.
Warning! Old version of the browser!
Press one of the icons below to proceed to the official website of the developer and download the latest version of your browser.

Online Forex broker
2022-08-26 • Updated
Information is not investment advice
In this article, we will discuss what the term confluence means and why traders should care about it.
Originally, the word ‘confluence’ means a place where two or more rivers come together to form a single water flow. In Forex, confluence refers to a situation when several technical tools give the same trade signal. Most of the time these are technical indicators, though sometimes they may be price patterns or price action. For this reason, some traders fill their charts with lots of indicators as they want to catch the desired confluence. However, often the result is conflicting signals, which confuses a trader. How to avoid the chart’s overloading? Use two or three indicators, that would be enough!
There is no strict classification of confluence. You are free to combine any technical tools you want. Only one thing is important: choose indicators that are independent of each other, in other words, not calculated using each other. Otherwise, you would risk finding a fake confluence, which may mislead you. Let’s discuss some good examples of using confluence.
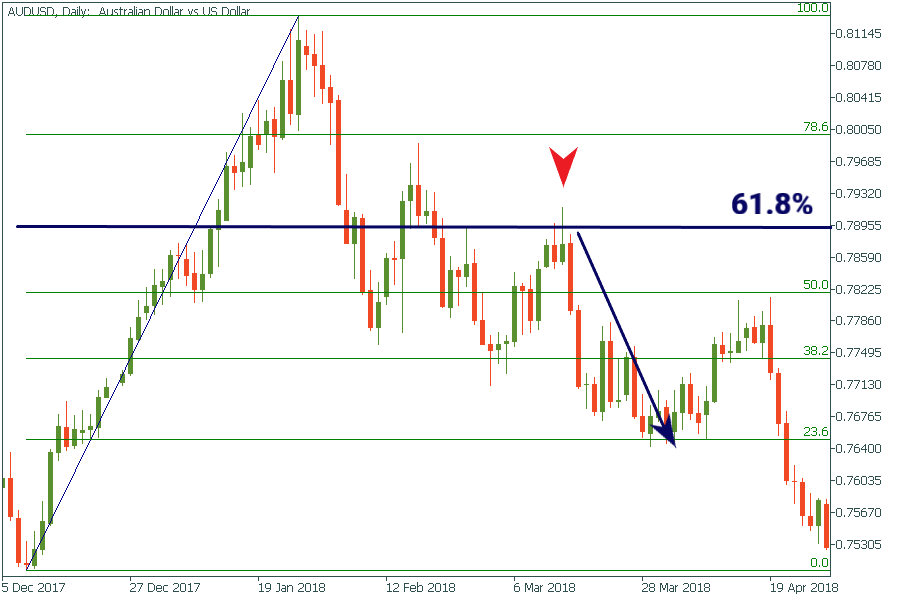
On the chart below you can observe a typical confluence: a shooting star in combination with the Fibonacci retracement. A shooting star is a candlestick with a long upper shadow and a little lower shadow, which gives a bearish signal. The 61.8% Fibonacci retracement level acts like a resistance, which stops the price from further rising. As a result, the price has reversed from this level and started falling.
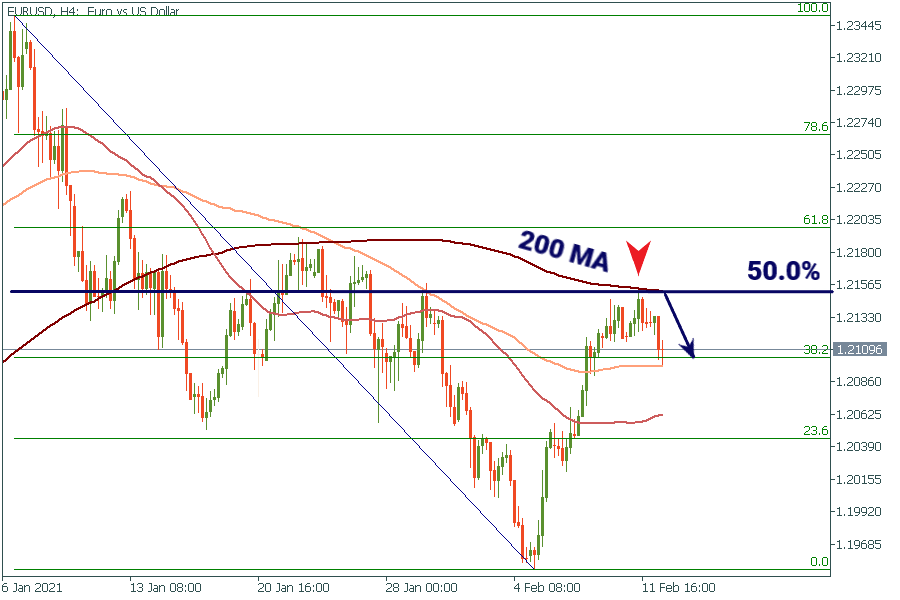
Here’s another example: the 200-period moving average coincides with the 50.0% Fibonacci retracement level. After the long rally up, the price bounces off the strong resistance at the intersection of the moving average with the Fibo level and starts falling.
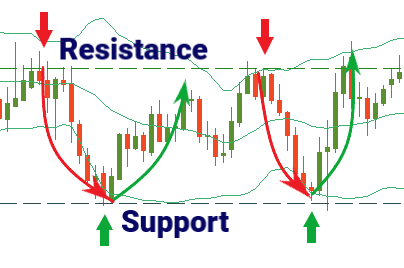
It’s a good idea to use the combination of Bollinger Bands (BB) with support and resistance levels. The BB indicator consists of 3 lines – a middle band and two outer ones.
When the price reaches the upper band, the asset is considered overbought. And if the upper line of BB coincides with the resistance level, the way down is likely to happen.
When a price approaches the lower band, the asset is trading at a relatively low price and is considered oversold. And if the lower line of BB coincides with the support level, the way up is likely to happen.
A confluence is a great tool for every trader. It’s based on the classic Forex principle: don’t rely only on one indicator, but at the same time, don’t overload your chart with dozens of indicators. This is essential in Forex to avoid fakeouts and unexpected reversals. In fact, most trading strategies are built on the concept of confluence. If you have not created yet your strategy, this is how you can start building it now from scratch!
Bill Williams is the creator of some of the most popular market indicators: Awesome Oscillator, Fractals, Alligator, and Gator.

Trend strategies are good - they may give significantly good results in any time frame and with any assets. The main idea of the ADX Trend-Based strategy is to try to catch the beginning of the trend.

Counter-trend strategies are always the most dangerous but also the most profitable. We are pleased to present an excellent counter-trend strategy for working in any market and with any assets.


Your request is accepted.
We will call you at the time interval that you chose
Next callback request for this phone number will be available in 00:30:00
If you have an urgent issue please contact us via
Live chat
Internal error. Please try again later