Engulfing
Engolição
O padrão de velas Engolição (Engulfing) é uma formação que habitualmente aparece antes da reversão da tendência. Este padrão é formado por duas velas: a primeira é menor e acaba por ser completamente “engolida” pela segunda (daí o nome). Os padrões do tipo Engolição são mais fáceis de observar no gráfico e podem ajudar o trader a identificar o melhor momento para entrar no mercado.
Neste artigo aprenderá sobre os padrões Engolição altista e baixista, o que é o padrão chamado Última Engolição e como pode usá-lo, bem como os principais prós e contras do uso de padrões Engolição no trading.
Padrão Engolição altista
O padrão Engolição altista é um tipo de padrão de velas que ocorre durante uma tendência de baixa e sinaliza possível reversão do movimento do preço e arranque de uma tendência de alta.
O padrão Engolição altista é formado por duas velas.
A primeira vela da formação é vermelha. Isto significa que o preço do ativo fechou abaixo do preço de abertura. A segunda vela, entretanto, é verde e mostra que o preço abriu abaixo do preço de fecho da vela anterior e fechou acima do preço de abertura anterior. O corpo da primeira vela é pequeno. O corpo da segunda vela é maior e se sobrepõe completamente (“engole”) a segunda vela. Isto sinaliza que, apesar do firme movimento de baixa registado pelo preço, os compradores começaram a reagir e causaram a reversão do preço e o arranque de uma tendência de ascensão.
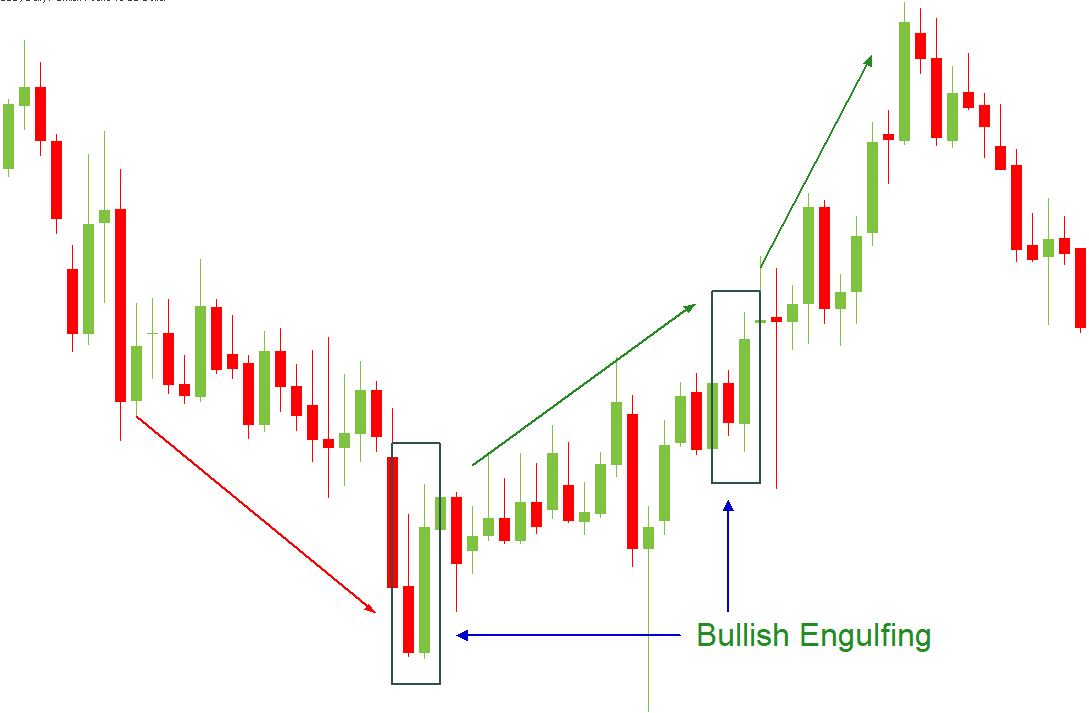
Os traders utilizam o padrão Engolição altista para descobrir a melhor hora de abrir uma posição comprada. Acredita-se também que o padrão Engolição altista é mais fiável quando precedido por várias velas pequenas, que indicam que o preço passou algum tempo em estancamento antes da reversão. Padrões Engolição altistas também podem atuar como indicadores de confirmação de tendência quando ocorrem numa tendência de alta.
No gráfico abaixo pode observar vários padrões do tipo Engolição altista. O primeiro ocorreu após uma tendência de baixa mais longa, sinalizando reversão no movimento do preço. A segunda Engolição altista se formou numa data posterior, durante tendência de alta, confirmando a continuação do movimento de ascensão.
Padrão Engolição baixista
O padrão Engolição baixista é o oposto do seu equivalente altista. Padrões Engolição baixistas ocorrem durante tendências de alta e indicam possível reversão para movimento de baixa.
Os padrões Engolição baixistas também são formados por duas velas. Neste caso, porém, a primeira vela é verde e a segunda é vermelha. A segunda vela é maior que a primeira e engole esta completamente, mostrando que os vendedores dominaram o mercado e começaram a rebaixar os preços.
Os traders utilizam este padrão para identificar o melhor momento de vender os ativos que têm atualmente. A Engolição baixista é mais fiável dentro de tendências estáveis. Em mercados instáveis, a Engolição baixista é menos significante e não serve para subsidiar decisões de longo prazo.
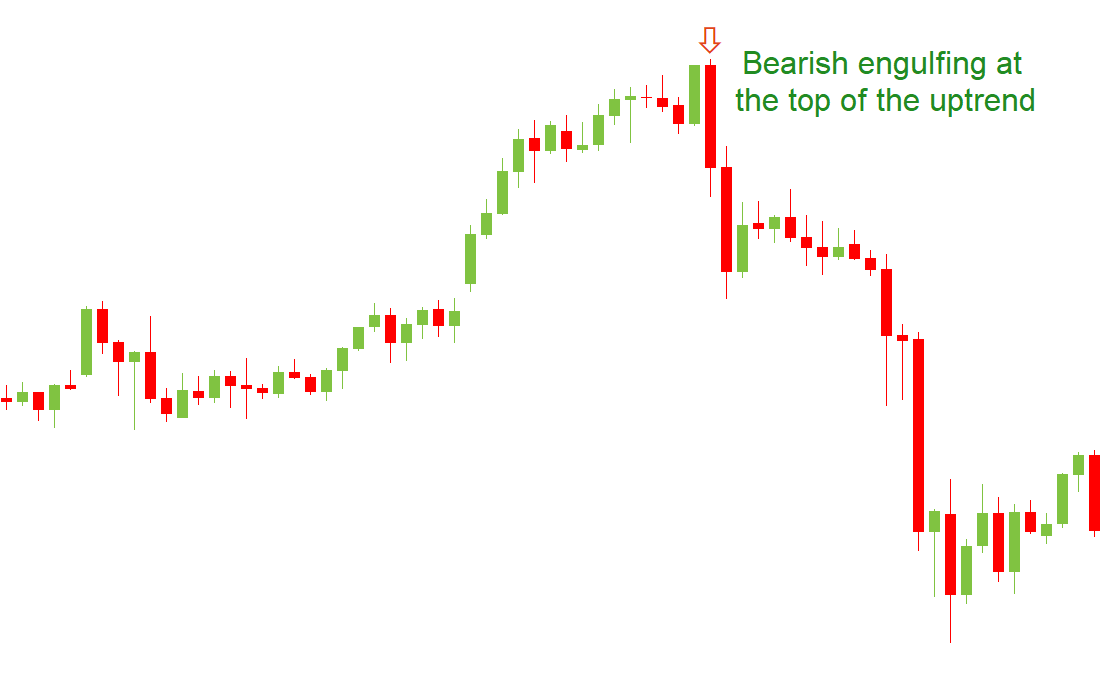
Este gráfico ilustra um padrão Engolição baixista clássico. Pode ver como que, após uma tendência de alta firme, a pequena vela verde é subitamente engolida pela grande vela vermelha, após a qual a tendência imediatamente sofre reversão e começa a sua descida.
Padrão Última Engolição
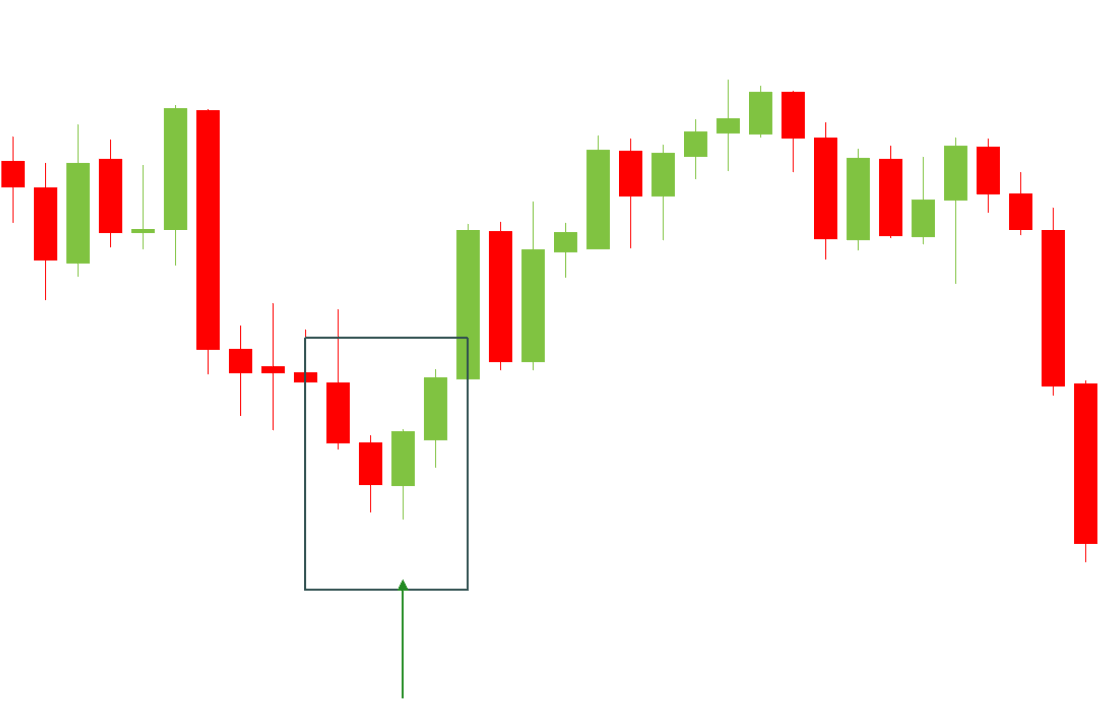
Há também um outro tipo de padrão Engolição menos frequente, chamado Última Engolição (Last Engulfing). Este padrão tem duas variantes: Última Engolição de fundo (bottom) e Última Engolição de topo (top).
A Última Engolição de fundo ocorre no ponto de mínimo da tendência de baixa. Este padrão é formado por uma vela verde menor, sucedida por uma vela vermelha maior que engole a antecessora. Observe que, ao contrário dos padrões mencionados anteriormente, a Última Engolição de fundo é precedida por velas vermelhas. Este padrão pode sinalizar a reversão altista da tendência ou a continuação da tendência baixista. Logo, é melhor aguardar a confirmação da reversão antes de fazer qualquer coisa.
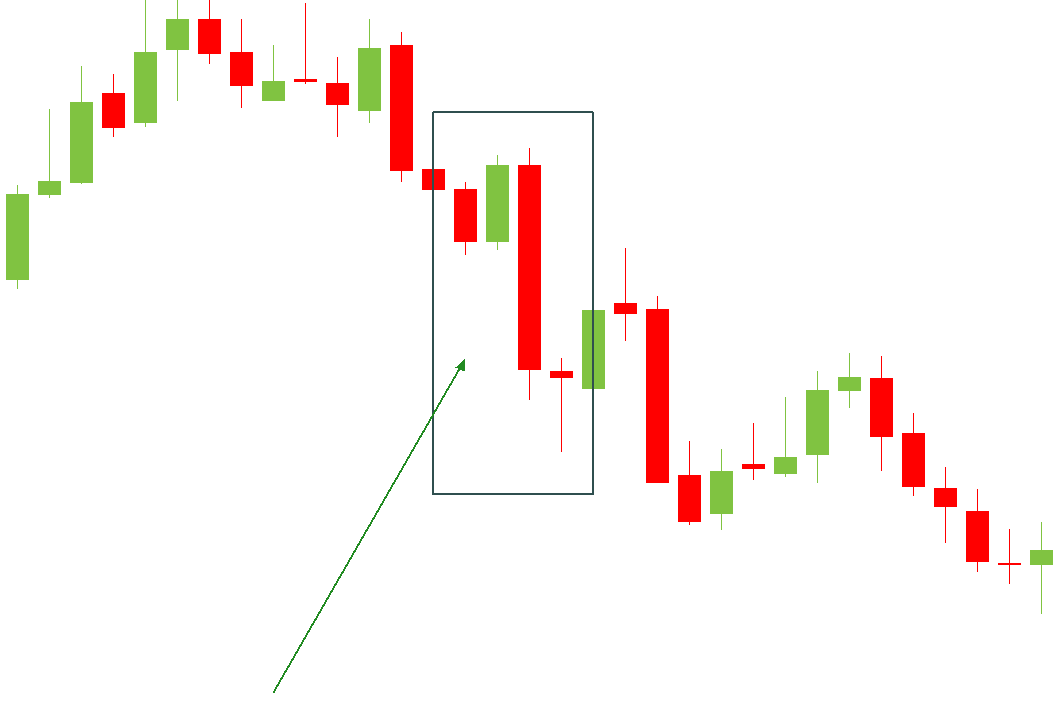
A Última Engolição de topo é o oposto e aparece no topo de uma tendência de alta. Inclui uma vela vermelha que é sucedida por uma vela verde maior. O padrão é precedido por várias velas verdes. Também exige confirmação da reversão e, por isto, não convém ter pressa para decidir ao identificá-lo no gráfico.
As vantagens dos padrões Engolição
- São fáceis de identificar e interpretar. Se observa uma grande vela com cor diferente da cor das velas anteriores (todas pequenas), pode deduzir que isto é sinal de uma mudança na direção do movimento do preço. Os padrões Engolição destacam-se das outras velas no gráfico. Mesmo um principiante pode identificá-los e tirar proveito das suas aparições.
- Podem ser utilizados com outros indicadores e recursos. Os padrões Engolição podem ser usados por traders que já usaram outros recursos e precisam de confirmação adicional da suposta reversão da tendência.
- São relativamente acurados. Os padrões Engolição têm bom histórico em termos de previsão de reversões de tendências, e por isto são geralmente considerados recursos bem fiáveis.
As desvantagens dos padrões Engolição
Nada pode ter 100% de exatidão. Em mercados instáveis, os padrões do tipo Engolição serão de pouca utilidade. Ademais, a segunda vela do padrão Engolição pode ser bem grande. Isto pode enganar o trader quando o objetivo é estabelecer uma meta de preço ou uma Stop Loss (Perda Máxima).
Considerações finais
No conjunto de padrões de velas de reversão, os padrões Engolição estão entre os mais fáceis de identificar. São um ótimo recurso para achar a melhor hora de entrar no mercado, sobretudo para traders principiantes. Os padrões Engolição geralmente são bem exatos. Todavia, convém aplicar outros métodos e indicadores para tomar decisões bem-sucedidas no trading.
Perguntas
O que é uma vela de Engolição altista?
O padrão de velas Engolição altista é um padrão gráfico que ocorre no ponto mínimo de uma tendência de baixa e sinaliza possível reversão do movimento do preço. Este padrão é formado por uma vela vermelha menor e uma vela verde maior que se sobrepõe à vela anterior e sinaliza o arranque da reversão altista.
O que é uma vela de Engolição baixista?
A Engolição baixista é um padrão gráfico que aparece no ponto máximo de uma tendência de alta e sinaliza possível reversão da tendência atual. Também é formada por duas velas: uma vela verde menor e uma vela vermelha maior. Esta última engole a primeira e sinaliza o arranque de uma nova tendência baixista.
O que é vela de Engolição?
As velas de Engolição são padrões gráficos que aparecem antes da reversão da tendência. Padrões deste tipo são formados por duas velas. A segunda vela é maior que a primeira e engole esta completamente.
2022-12-29 • Atualizado
Escolha seu sistema de pagamento