


Williams’ Strategy
Bill Williams is the creator of some of the most popular market indicators: Awesome Oscillator, Fractals, Alligator, and Gator.

Don’t waste your time – keep track of how NFP affects the US dollar!
Data Collection Notice
We maintain a record of your data to run this website. By clicking the button, you agree to our Privacy Policy.

Beginner Forex Book
Your ultimate guide through the world of trading.

Check Your Inbox!
In our email, you will find the Forex 101 book. Just tap the button to get it!
Risk warning: ᏟᖴᎠs are complex instruments and come with a high risk of losing money rapidly due to leverage.
66.43% of retail investor accounts lose money when trading ᏟᖴᎠs with this provider.
You should consider whether you understand how ᏟᖴᎠs work and whether you can afford to take the high risk of losing your money.
Warning! Old version of the browser!
Press one of the icons below to proceed to the official website of the developer and download the latest version of your browser.

Online Forex broker
2022-03-31 • Updated
Information is not investment advice
Although the market is flat 70% of the time, most of the trading strategies are for trend trading. Thus, most traders use only 30% of the trading potential! If you want to be more productive, pay attention to this strategy.
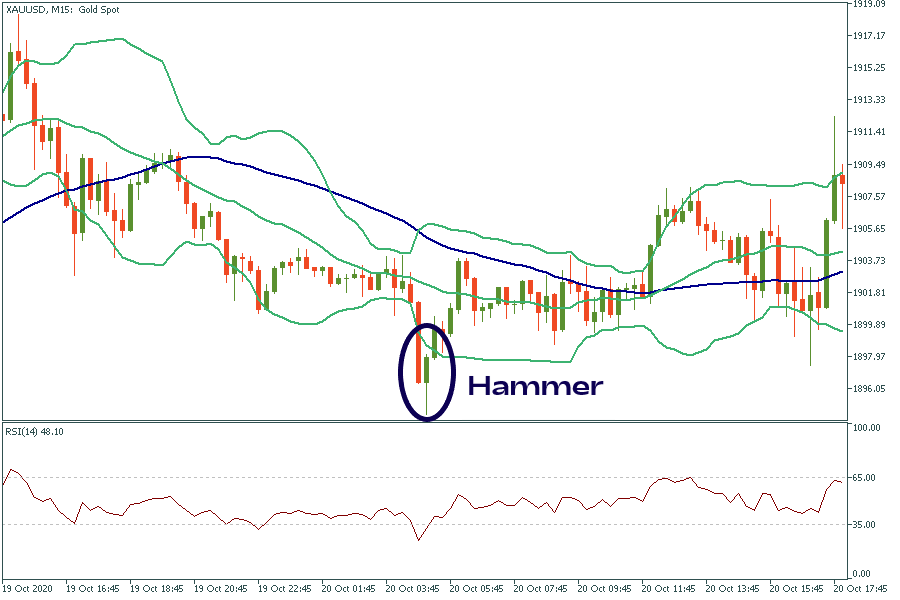
Prices can move in trends (up/down) or move sideways without any clear direction. This strategy applies to the second option – when the market is flat. Most of the success depends on how good a trader finds the entry and exit points. Sometimes, it’s really hard to define, that’s why traders use technical indicators and price patterns.
You will need the following indicators for this strategy:
There are two ways of doing that. It’s better to use a 4-hour timeframe (H4).
For beginners
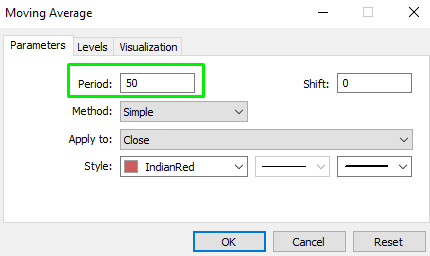
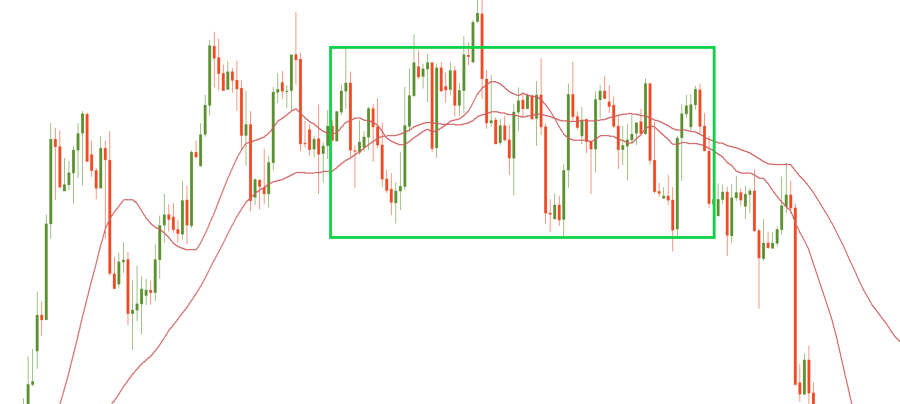
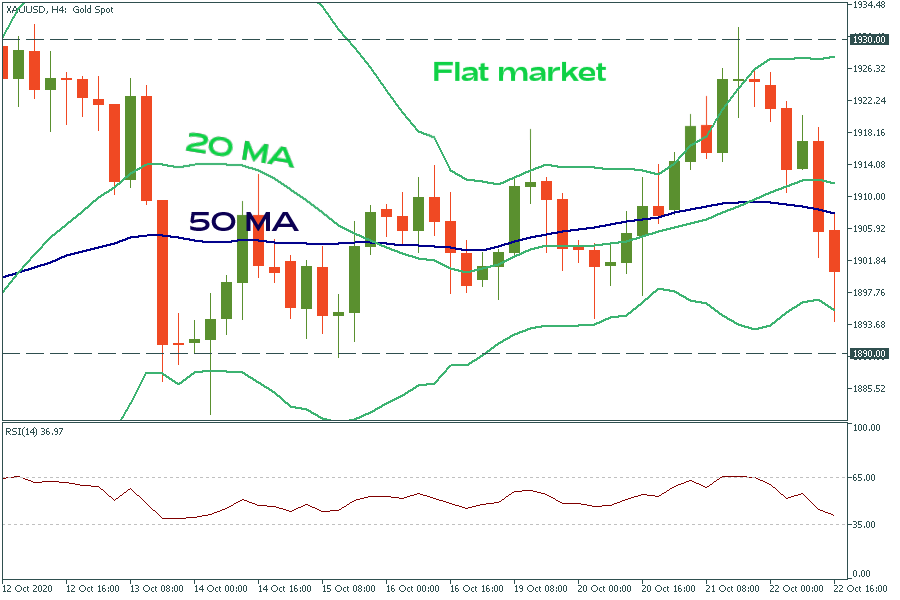
Follow the signals of moving averages. If two moving averages are intersected or move in parallel, it’s a signal that the market is flat. It’s recommended to use 20- and 50-period moving averages for this purpose.
For intermediate traders
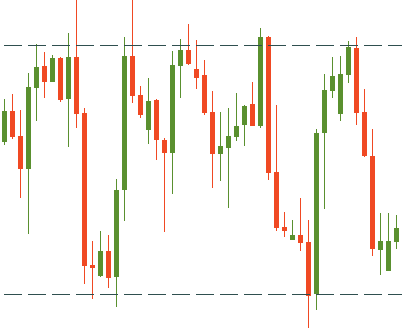
Define at least two price maximums on the same level and draw a horizontal line. Do the same with minimums. After that, you will get a horizontal corridor.
*Tip! Use both approaches and the signal will be stronger.
*Tip! Save the charts with the set indicators as a template. Further on you shouldn’t set these indicators and their settings again. To do that, click on any place of the chart with the right mouse button, then click ‘Templates’, then ‘Save Template’. Done!
To open a BUY order, all the conditions below should be met.
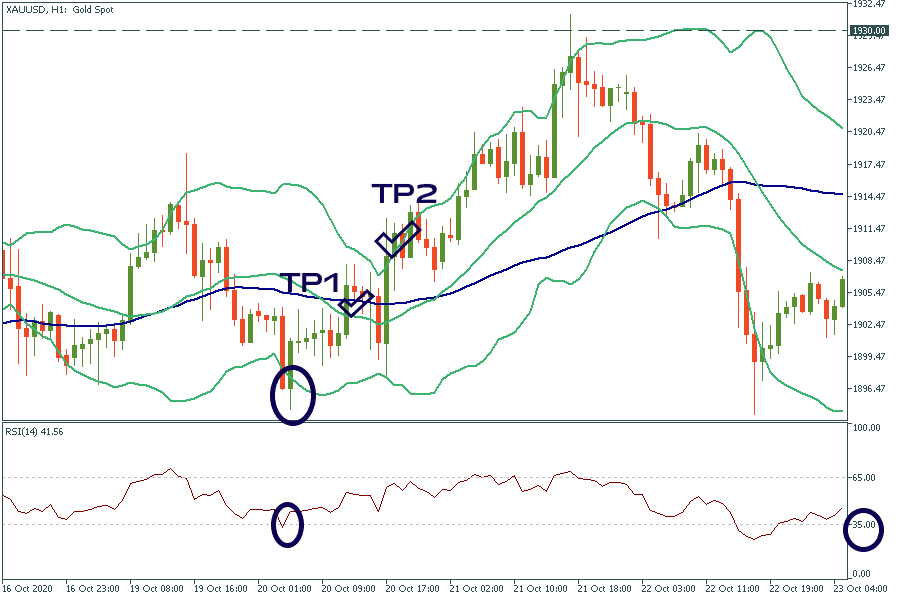
To open a SELL order, all the conditions below should be met.
This strategy suits both beginners and more advanced traders as on the one hand, it is based on simple indicators and on the other hand, requires several levels of filtration and confirmation of trade signals.

Bill Williams is the creator of some of the most popular market indicators: Awesome Oscillator, Fractals, Alligator, and Gator.

Trend strategies are good - they may give significantly good results in any time frame and with any assets. The main idea of the ADX Trend-Based strategy is to try to catch the beginning of the trend.

Counter-trend strategies are always the most dangerous but also the most profitable. We are pleased to present an excellent counter-trend strategy for working in any market and with any assets.


Your request is accepted.
We will call you at the time interval that you chose
Next callback request for this phone number will be available in 00:30:00
If you have an urgent issue please contact us via
Live chat
Internal error. Please try again later