


Williams’ Strategy
Bill Williams is the creator of some of the most popular market indicators: Awesome Oscillator, Fractals, Alligator, and Gator.

Don’t waste your time – keep track of how NFP affects the US dollar!
Data Collection Notice
We maintain a record of your data to run this website. By clicking the button, you agree to our Privacy Policy.

Beginner Forex Book
Your ultimate guide through the world of trading.

Check Your Inbox!
In our email, you will find the Forex 101 book. Just tap the button to get it!
Risk warning: ᏟᖴᎠs are complex instruments and come with a high risk of losing money rapidly due to leverage.
66.43% of retail investor accounts lose money when trading ᏟᖴᎠs with this provider.
You should consider whether you understand how ᏟᖴᎠs work and whether you can afford to take the high risk of losing your money.
Warning! Old version of the browser!
Press one of the icons below to proceed to the official website of the developer and download the latest version of your browser.

Online Forex broker
2022-08-26 • Updated
Information is not investment advice
By this time, you have already learned some basics. Now it’s time for trading strategies! Today we will discuss three most popular and useful ones. After reading the article, try them out on a demo account. These strategies will help you understand how trading works and provide you with a plan of action.
You will be surprised by how much just one candlestick may tell you about the market. Notice that these strategy is about Japanese candlesticks.
The best example is the so-called ‘hammer’ pattern. It can signal an end of a downtrend, a bottom or a support level. It’s really easy to spot this pattern on a chart as it looks like a real hammer: a long handle and a head. A handle or a candlestick’s shadow should be at least twice the length of the real body. Look for such candlestick after price’s decline – this is an important condition. Wait for the hammer candlestick to close: until it does so, the shape of a candlestick may change and it may not be a hammer after all.
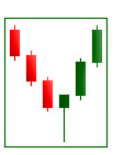
Buy when the following candle starts forming or, in you want further confirmation, when the following candlestick closes above the opening price of the candlestick on the left of the hammer. The color of a hammer doesn’t matter, though if it’s green, the signal to buy is stronger.
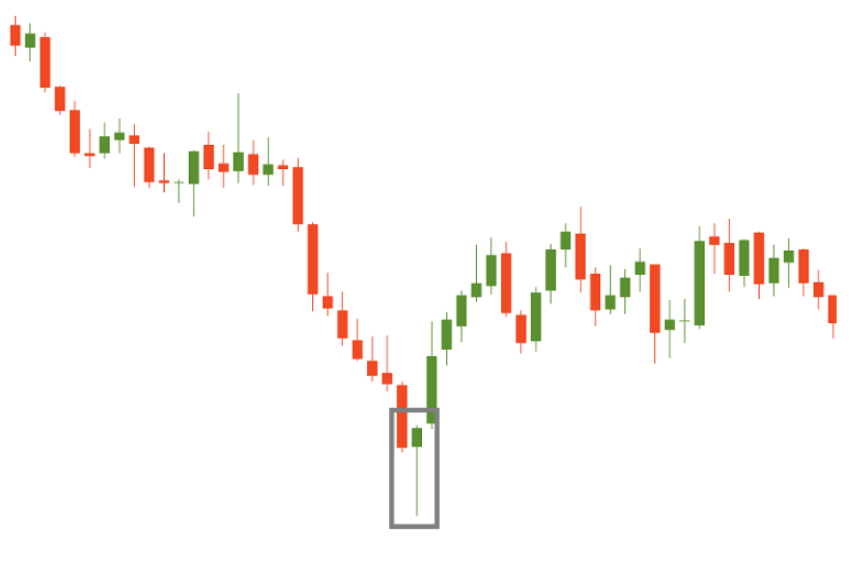
Here’s how a hammer looks like at the real chart:
A ‘shooting star’ is quite similar to a hammer. It’s a one-candle pattern too. The candlestick’s body is also small and the shadow exceeds the body in at least 2 times. However, unlike a hammer, a shooting star has a shadow above the body and is a signal to sell. The candle may be of any color, though if it’s red, the sell signal is stronger.
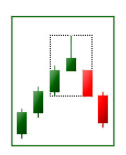
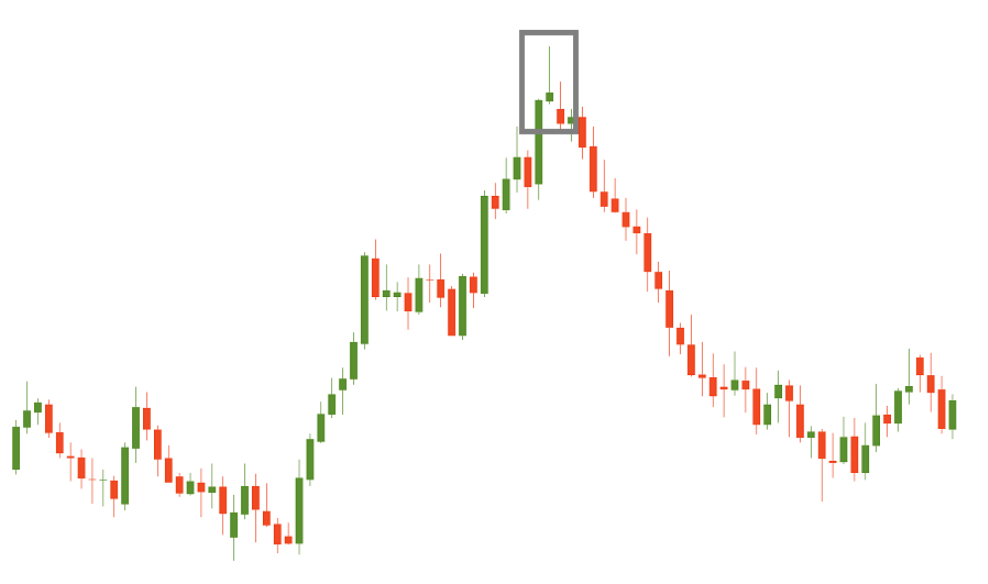
Here’s how a shooting star looks at the real chart:
The previous strategy was about candlestick patterns. Now let’s proceed to simple, yet efficient chart patterns.
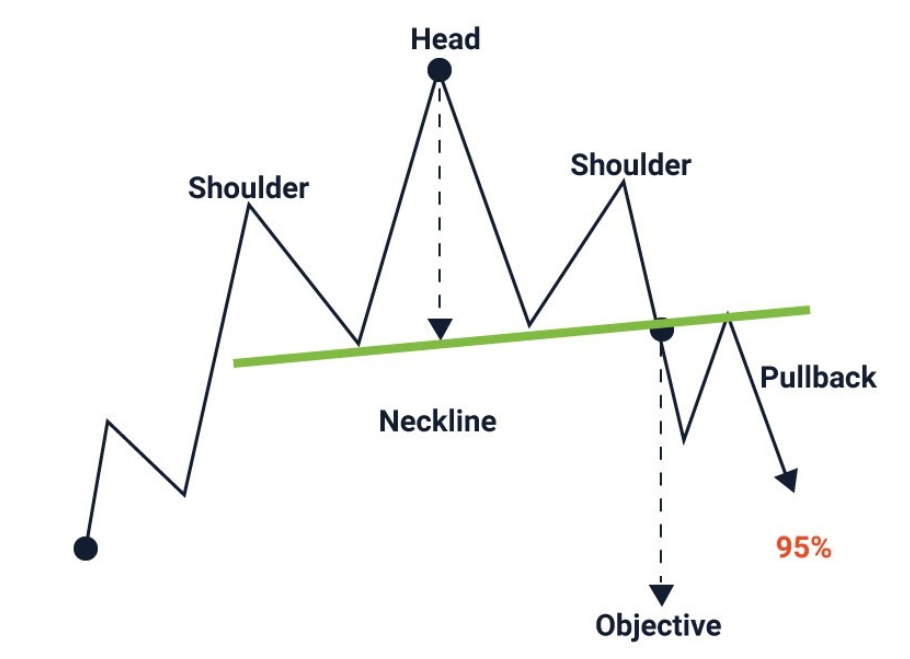
A ‘head-and-shoulders’ pattern occurs at the end of an uptrend. It consists of a head (the second and the highest peak), two shoulders (lower peaks) and a neckline (the line that connects the lowest points of the two troughs and represents a support level). The neckline may be either horizontal or sloping up/down. The signal is more reliable when the slope is down rather than up.
The pattern is confirmed when the prices breaks below the neckline after forming the second shoulder. The odds are that after this the price starts a downtrend. As a result, a sell order is put below the neckline. Measure the distance between the highest point of the head and the neckline. This distance is approximately how far the price will move after breaking below the neckline.
Notice that prices tend to return to the neckline after the initial breakout. In this case, the neckline, which used to be a support, often acts as resistance.
An ‘inverse head-and-shoulders’ pattern is the exact opposite of the head-and-shoulders. It occurs at the end of a downtrend and indicates a bullish (upward) reversal.
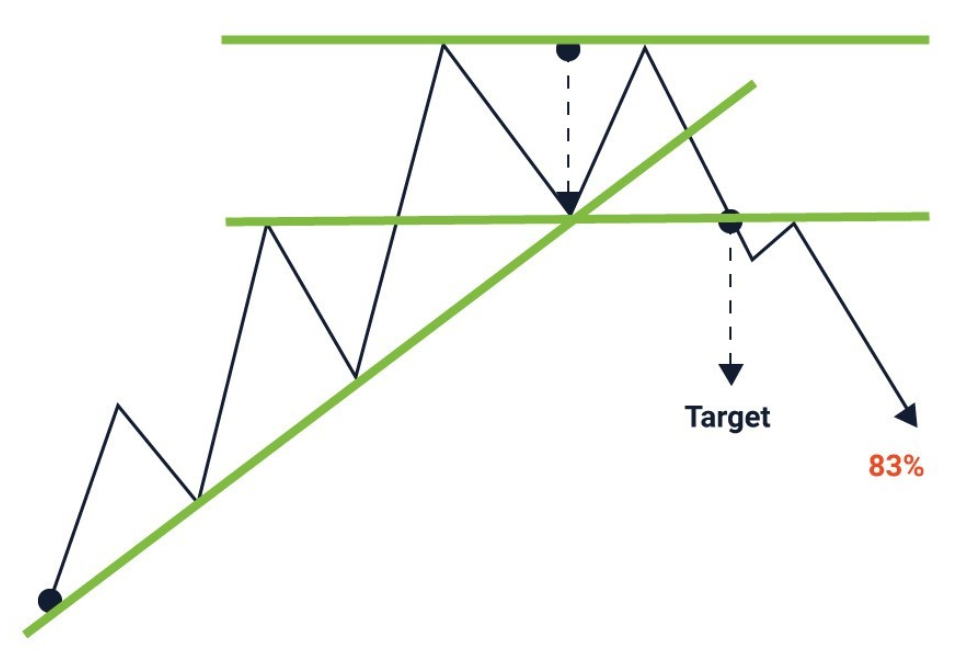
A ‘double top’ also usually forms at the end of an uptrend. Traders use it really often. The pattern consists of two consecutive peaks of similar (or almost) height with a moderate trough between them. The neckline is drawn horizontally through the lowest point of a trough.
The pattern is confirmed when the price breaks below the neckline after forming the second shoulder. Once it happens, the currency pair should start a downtrend. Put a sell order below the neckline. Measure the distance between the peaks and the neckline – this distance is approximately how far the price will move after it breaks the neckline. After the breakout, the price may return to the neckline for a short time before it resumes its slide – this is s good opportunity to open a sell order at a higher price.
A ‘double bottom’ is the exact opposite of a ‘double top’. It occurs at the end of a downtrend and indicates a bullish (upward) reversal.
The similar patterns with three peaks/troughs are called ‘Triple top’/’bottom’. The logic of trading is the same.
In the previous strategies we used nothing but the price chart itself. Now it’s time to apply a technical indicator called ‘Moving Average’, MA for short.
Moving average is a trend indicator. MA shows average price for a period, so its fluctuations are smoother than those of the price chart itself. For example, if we have 10-day MA, we calculate a sum of the last 10 prices and divide it by 10. As new candlesticks appear on the chart, the oldest one isn’t counted anymore.
There are four types of MAs: simple, exponential, linear weighted, and smoothed. We recommend starting with the simple one.
In the top menu, go to “Insert” – find “Indicators” – go to “Trend” – and choose Moving Average. It’s more important to apply correct settings.
A period is a number of candlesticks that will be taken into consideration for calculating. The bigger the period is, the smoother the MA. The smaller the period, the closer the MA will be to the price.
Traders prefer MAs with 50, 100, and 200 periods for big timeframes and 9, 12, and 26 for smaller timeframes.
There are several options. It can be close, open, high, low, median, typical and weighed close prices. However, usually, traders use the close price.
This setting is used to pull the indicator forth and back on the time scale. As a result, the MA will move to the right or to the left.
You can use MA as a trend indicator: if it goes down, it’s a downtrend; if it goes up, it’s an uptrend. Moreover, a Moving Average crossover may help a trader to decide when to enter and exit the market. A moving average crossover happens when two different MAs cross each other. There are two types of crossovers: golden and dead.
When a MA with a smaller period crosses a MA with a bigger period bottom up, it’s a signal to buy.
When a MA with a smaller period crosses a MA with a bigger period upside down, it’s a signal to sell.
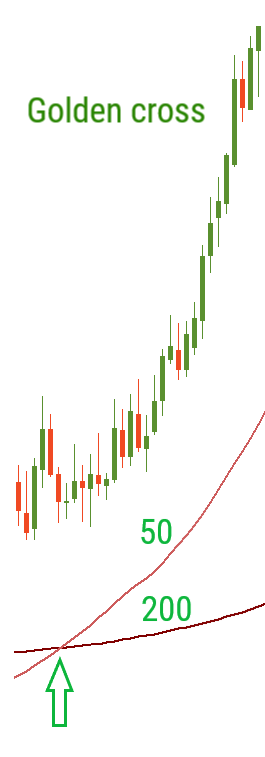
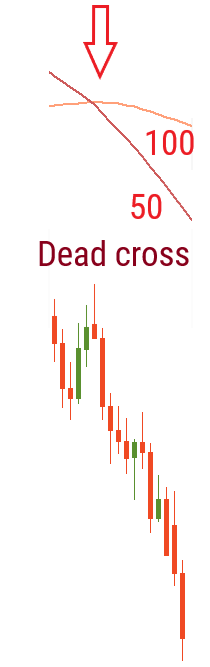
Note the golden cross usually works when the price is above the MA, or in case of the dead one – below the MA.
Let’s sum up what you’ve learned today:
Awesome! Now you are able to use all these trading strategies. As everybody knows, the best way to digest information is practice. So, go and try it!

Bill Williams is the creator of some of the most popular market indicators: Awesome Oscillator, Fractals, Alligator, and Gator.

Trend strategies are good - they may give significantly good results in any time frame and with any assets. The main idea of the ADX Trend-Based strategy is to try to catch the beginning of the trend.

Counter-trend strategies are always the most dangerous but also the most profitable. We are pleased to present an excellent counter-trend strategy for working in any market and with any assets.


Your request is accepted.
We will call you at the time interval that you chose
Next callback request for this phone number will be available in 00:30:00
If you have an urgent issue please contact us via
Live chat
Internal error. Please try again later