


Trend Indicators
Trend Indicators
There are two approaches to trading: trading in the direction of the current movement (trend trading) and trading against that direction (counter-trend trading), ideally if the trader can combine both approaches.
To do this competently, one must learn to use particular indicators that help identify these trends.
What is trend trading?
Trading on the trend is trading in the direction of the current market movement. For example, if an asset moves upward, such a move is called a bull move. Trend-following traders will try to open trades on an asset upwards and take profits when the asset rises.
When an asset moves downward, the trend is called bearish, and trading on the trend will involve opening trades downward. When the asset falls enough, those trades will be closed.
Trend trading - we swim with the current.
What is counter-trend trading?
Trading against the trend is trading against the direction of the current movement. In this case, the trader tries to determine the moment of trend reversal. Usually, this is done when the price has deviated strongly enough from its average value and comes back.
What are trend indicators?
Trend indicators are indicators that allow you to determine the current trend and the moment of its change.
Trend indicators can be used only when there is a bullish or bearish trend. During a flat market, trend indicators cannot be used.
Examples of trend indicators
Here is a list of some of the most popular trend indicators:
- Moving averages
- Bollinger Bands
- Parabolic SAR
- MACD lines
- Ichimoku Cloud
How to use moving averages?
The construction of moving averages is most often done by closing prices.
A simple moving average is calculated as a simple arithmetic average of closing prices for a selected period.
When constructing a weighted moving average, it is taken into account that recent prices are more important. Thus, prices are assigned certain weights in the calculations. The calculation is done by summing the products of weights by the values of prices referred to the sum of weights.
The exponential moving average is calculated according to a more complex formula and assumes a more "smoothed" removal of prices from the calculations. Thus, EMA is more "smart" than other moving averages.
The smoothed moving average is almost the same as the simple MA. In fact, the simple moving average is being smoothed to get fewer false signals.
Orders of moving averages are selected at the discretion of market participants. The most used orders of moving averages are 10, 13, 21, 50, 89, 144, and 200.
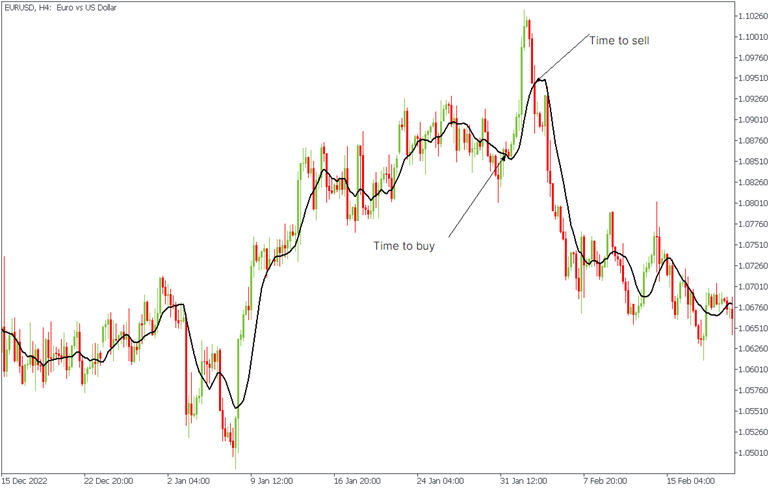
The clearest signal produced by the moving average crosses an average with the price.
If the price crosses the moving average downwards, it is a sell signal.
If it crosses upwards - it is a signal to buy.
Picture 1. Example of Buy signal and Sell signal.
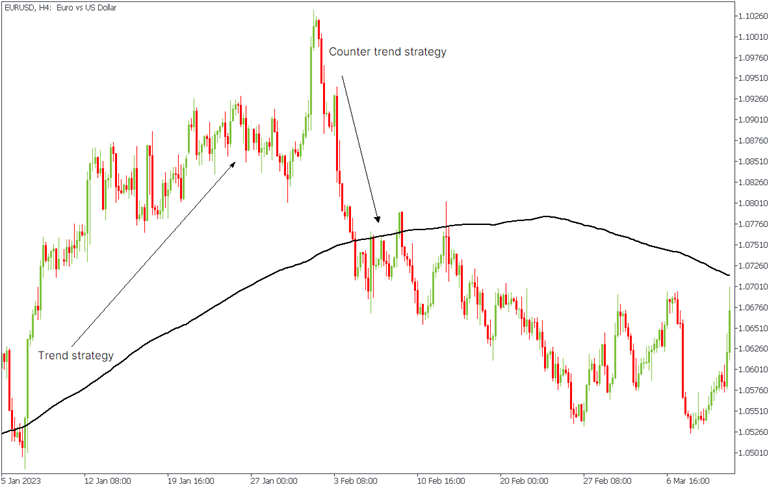
Higher order moving averages (e.g., 200th) are used to determine the global trend and overall trading strategy. The trader should move toward the trend if the price has stayed consistent with the moving average. But if the deviation is strong enough, a counter-trend strategy can be chosen, expecting the price to return to the moving average gradually.
The moving average may be used as the dynamic support or resistance level. When the price approaches the moving average, there is a possibility that it will bounce back. That’s why we strongly recommend paying attention to the moving average and using it when deciding what to do in the market.
Picture 2. Trend and Counter-trend strategy
Bollinger Bands indicator
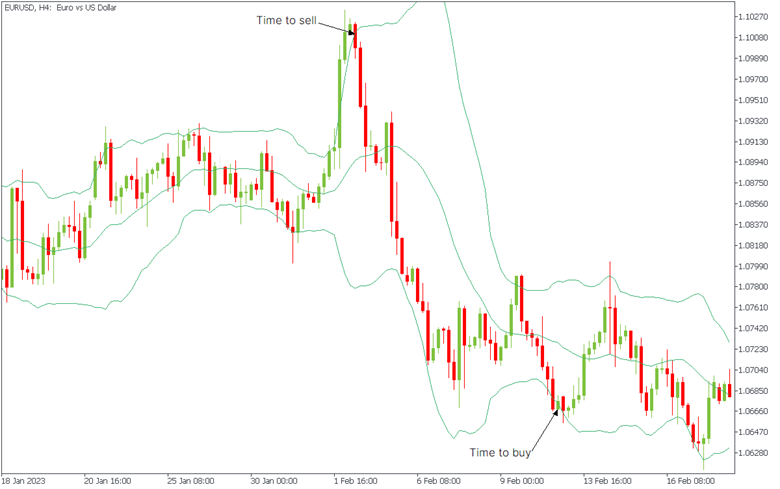
Bollinger Bands are built based on a simple moving average (SMA) and are three bands, the middle of which is the SMA, the bands above and below - the lines built on the distance of the standard deviation from the average band.
The specified bands form a corridor where the price moves. The bands are drawn so that 95 percent of prices fall inside the bands and 5 percent remain outside. It allows us to predict the moment of a price reversal, i.e., price movement out of the bands with high probability means price movement in the opposite direction, i.e., price return inside the bands.
Bollinger Bands are a good indicator for building counter-trend strategies.
Picture 3. Bollinger Bands indicator
Parabolic SAR indicator
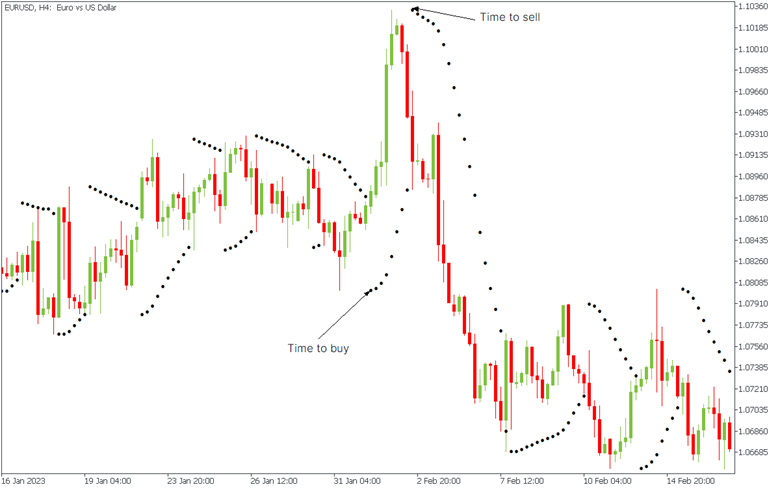
The Parabolic SAR indicator is a reasonably simple trend indicator representing points above and below the price chart. When the price rises, the dots appear below the chart. When the price decreases, the dots unfold and appear above the chart.
The Forex trend indicator is constructed so that it is constantly approaching the price with each new candle and the price movement until, sooner or later, it will not turn around.
When the indicator appears below the price - it is time to open transactions upwards; when it is above the price - it is time to trade downwards.
Picture 4. Parabolic SAR Indicator
MACD
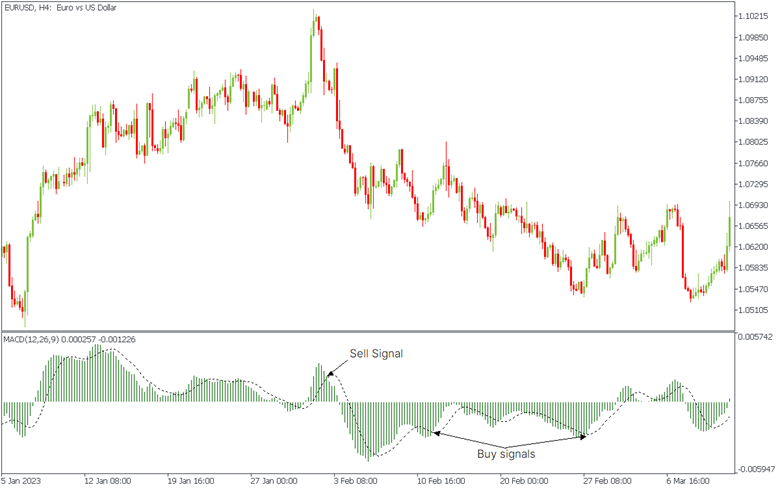
The American technical analyst Gerald Appel developed the MACD (Moving averages convergence-divergence) indicator. Appel suggested using the trend trading indicator parameters 12,26,9. Let us find out what these parameters mean.
The MACD line is the difference between two exponential moving averages of orders 12 and 26 (i.e., EMA (12) - EMA (26)). This line is "fast”, i.e., more volatile (in MT4, and MT5 it is represented by a histogram).
The second line is called the signal line. This line is slow, i.e., less changeable. It is obtained after averaging the obtained difference with another exponential moving average of order 9 (i.e., EMA (9)[EMA (12) - EMA (26)]).
A buy or sell signal is given when the two lines cross.
When the MACD line crosses the signal line upwards, this is a signal for opening a trade upwards.
When the MACD line crosses the signal line downwards, this is a signal to open a trade downwards.
Picture 5. MACD
Ichimoku cloud
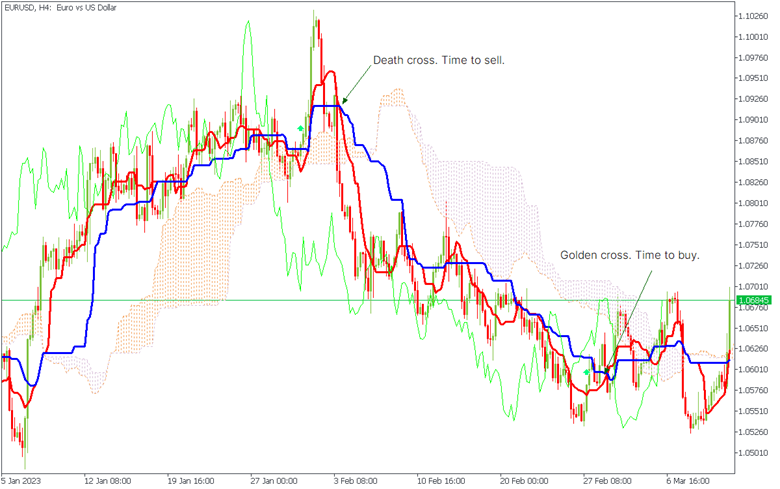
The Ichimoku Cloud is a market trend indicator developed by Goichi Hosoda. The indicator comprises five lines on the candlestick graph: Tenkan sen, Kijun sen, Senkou Span A, Senkou Span B, and Chikou Span.
Since this is quite a complicated indicator, we will only understand the lines Tenkan Sen and Kijun Sen. You can find more information about Ichimoku Cloud in our article “How to use Ichimoku cloud?”
To open a trade, wait for the following signal: a cross of the Tenkan Sen and Kijun Sen lines (TK cross). If the Tenkan Sen line crosses the Kijun Sen line from the bottom up, this is a signal to trade up, also called the “Golden Cross”.
If the Tenkan Sen line crosses the Kijun Sen line from top to bottom, this is a signal to trade down, also called the “Death Cross”.
Picture 6. Ichimoku cloud
Which indicator is the best?
There is no such thing as the best or the worst indicator. Each indicator is individual and selected for a specific purpose or asset.
We recommend paying particular attention to the moving averages because it is the most famous indicator, and therefore its importance in the technical analysis is difficult to overestimate.
Conclusion
Whatever indicator you use, you should remember that they usually lag the price. The price movement is primary, and the indicator movement is secondary. Therefore, regardless of what signals are presented, you should always be extremely careful when placing trades.
Use trending indicators and increase your trading efficiency with the trading platform.
Disclaimer: This is for informational purposes only and do not contain - or to be considered as containing - investment advice, suggestion or recommendation for trading.
2023-05-11 • Updated
Choose your payment system


