


What Are Market Trends?

Have you ever wondered what a market trend is and how to spot it? If so, this article is what you need.
What is a market trend: definition and meaning
A market trend refers to the general direction in which a particular market or asset moves over time. It provides valuable information about the prevailing sentiment among buyers and sellers, affecting price movements and trading volumes. Understanding market trends is essential for successful trading as it helps identify opportunities and manage risks.

Different types of market trends
Understanding the types of market trends can equip traders with valuable information about the overall market dynamics and help them make more informed decisions.
Direction-based trends
Market experts classify trends based on the direction of price movement, highlighting three main types – uptrends, downtrends, and sideways.
Uptrend
An uptrend, also known as a bullish trend, refers to a consistent upward movement in prices. Each subsequent peak in the price is higher than the previous one, and each subsequent low is also higher than the previous one. Traders can potentially benefit by placing buy orders during uptrends.
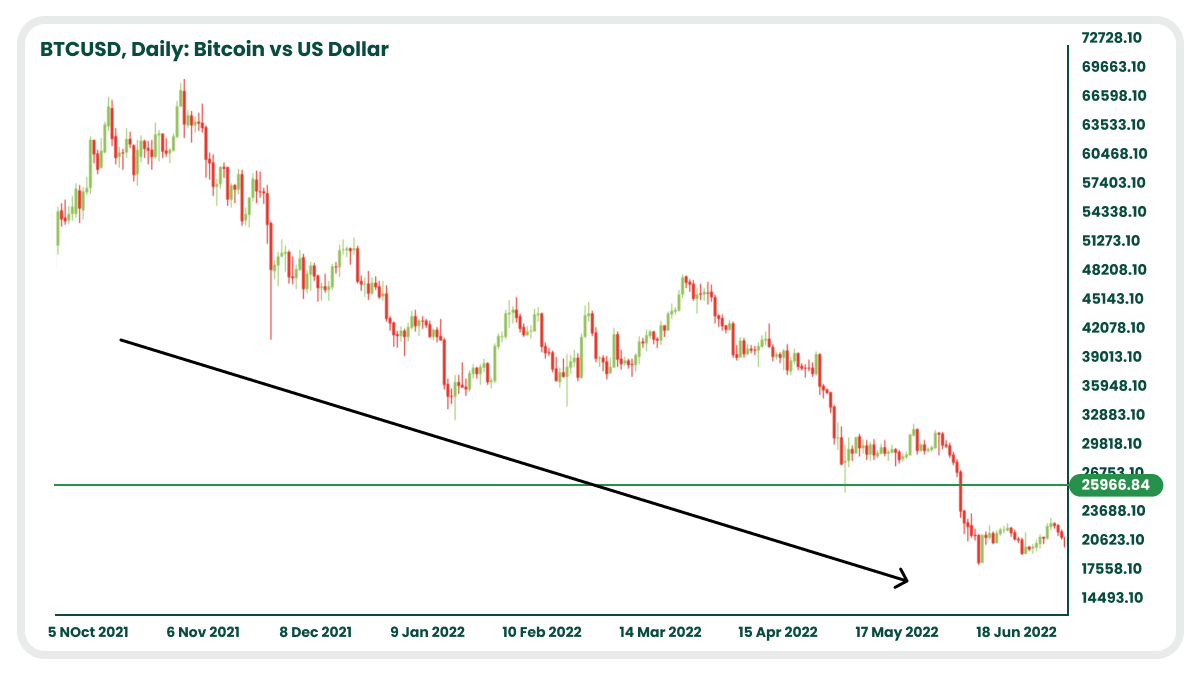
Downtrend
Conversely, a downtrend, also known as a bearish trend, occurs when prices form lower highs and lower lows. Each subsequent low in the price is lower than the previous one, and each subsequent high is also lower than the previous one. Trend traders take advantage of downtrends by placing sell orders.
In the image below, you can see that downtrends form visible curves, gradually reaching lower price levels.
Sideways trend
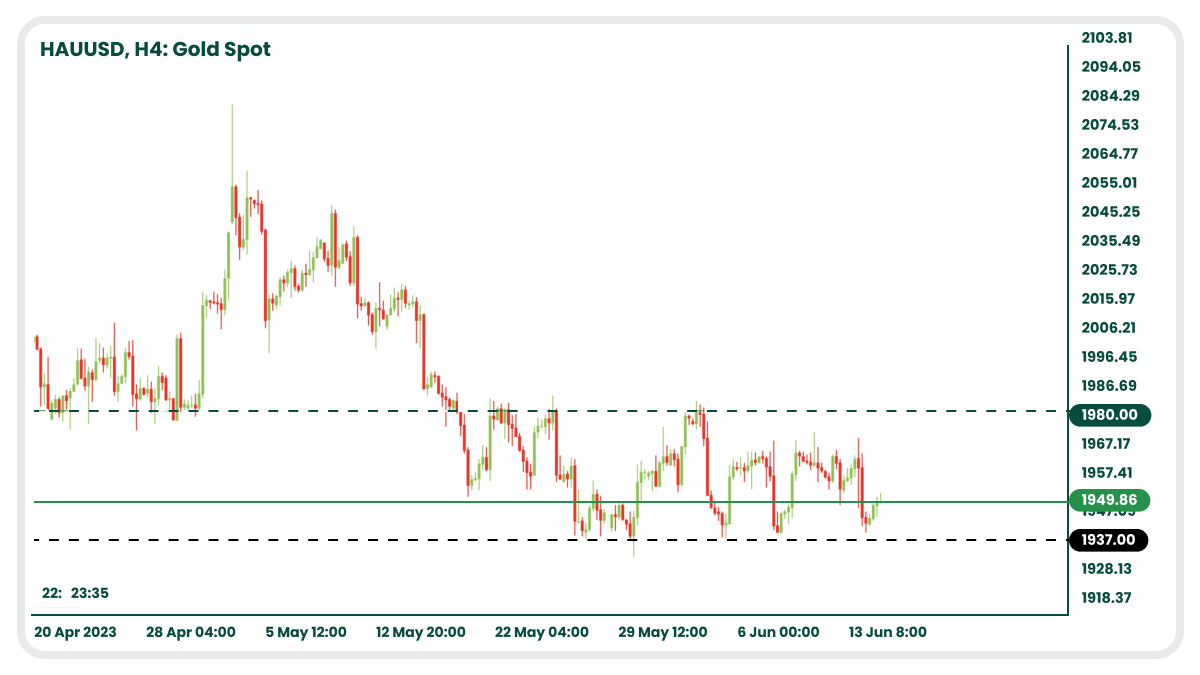
A sideways trend, also known as a flat or neutral trend, occurs when an asset price moves within a specific price range, fluctuating up and down without displaying a clear upward or downward direction. During a sideways trend, traders may experience limited opportunities for significant gains, as the price tends to remain within a defined range.
The chart below shows that within a sideways trend, consecutive highs and lows are situated at approximately the same level. This creates a horizontal pattern that indicates a lack of significant price movement in either direction.
Duration-based trends
Uptrends, downtrends, and sideways trends can vary in their timeframes. These trends can persist for a few days to several years. Traders need to be aware of trends’ trading timeframe and align their strategies accordingly.
Long-term trends
Long-term trends last from several months to several years. These trends are influenced by shifts in the business cycle and significant political and economic events.
Intermediate trends
Intermediate trends usually span a few weeks to a few months. They are driven by changes in traders’ sentiment and technical factors.
Short-term trends
Short-term trends refer to fluctuations happening within a few days up to a month. The main drivers here are current news and changes in trading volume.
How to identify market trends and use them in your favour
There are multiple methods and approaches that traders can use for their benefit to effectively determine market trends, therefore increasing the probability of successful trades.
Here are some practical steps to help you spot trends and leverage them to your advantage.
Conduct technical analysis
Technical analysis and its tools provide signals that can guide your decision-making process. So utilize chart patterns and trendlines to analyze price movements and identify trends. Look for patterns of higher highs and higher lows in uptrends or lower highs and lower lows in downtrends. Use moving averages or oscillators to confirm trend strength and momentum.
Perform fundamental analysis
Keep an eye on economic data, earnings reports, news events, and industry trends. These factors contribute to a broader understanding of market trends and provide insights into potential impacts on price movements.
Monitor market sentiment
Such indicators as the Fear and Greed Index or the Put-Call Ratio can clarify the overall mood of market participants and potential shifts in trends. So consider market sentiment to gain additional perspectives to your approach.
Use multiple timeframes
Analyze trends across different timeframes to gain a comprehensive view of the market. Consider using higher timeframes to identify trends. In this case, the ideal formula is 1:4. If trading in the 1-hour timeframe, identify the trend on the 4-hour timeframe.
Implement risk management strategies
Always incorporate risk management techniques, such as setting stop-loss orders and managing position sizes. These strategies help protect your capital during volatile market conditions and mitigate potential losses.
Example of a trend
To better understand market trends, let's consider an example. Suppose the stock price of XYZ Company has been consistently increasing over the past few months, forming higher highs and higher lows. This indicates an uptrend. By drawing a support trendline connecting the successive higher lows, we can visually confirm the market's upward trajectory.
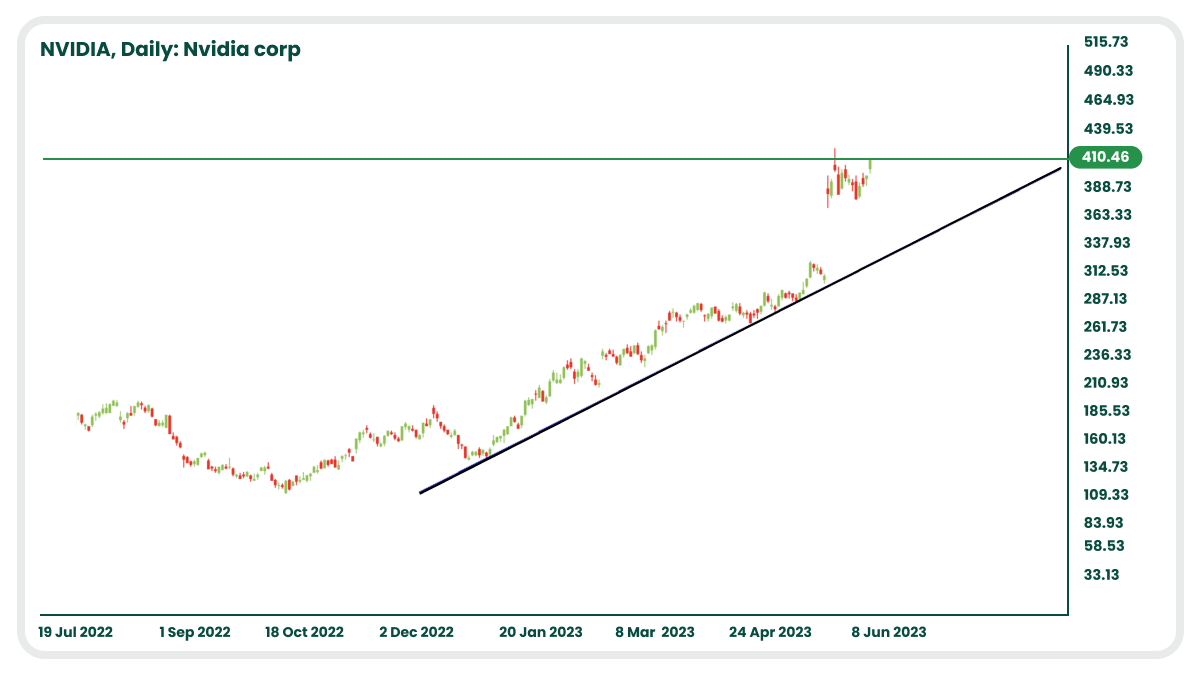
NVIDIA shares have been in an uptrend since December 2022 and have increased by more than 190%.
Trendlines visually represent market trends and help traders identify potential support levels in uptrends or resistance levels in downtrends. They act as dynamic levels that indicate potential areas where buyers or sellers may enter the market.
What factors influence a market trend?
Market trends are influenced by a variety of factors. Here are three major elements that shape market trends.
- Geopolitical events and government decisions on monetary and fiscal policy
- Economic indicators, such as GDP growth, inflation rates, and interest rates
- Investor sentiment, market psychology, and the behaviour of institutional investors
Final thoughts
Understanding market trends is crucial for traders and investors to navigate the dynamic world of trading. By analyzing market trends through technical and fundamental analysis, traders can identify opportunities, manage risks, and make more informed trading decisions.
Remember that market trends are not static, and it is essential to continually monitor and adapt your strategies to the ever-changing market conditions. With a systematic approach and proper risk management, you can leverage market trends to enhance your trading success.
FAQ
What is a market trend?
The market trend refers to the movement of an asset’s price over time. In technical analysis, if prices consistently reach higher highs and higher lows, it indicates an uptrend. Conversely, if prices consistently show lower highs and lower lows, it signifies a downtrend. Traders rely on market trends to recognize possible changes in the market that they can use for speculative purposes.
Can market trends be predicted with 100% accuracy?
While it is impossible to predict market trends with absolute certainty, analyzing historical price data, market indicators, and fundamental factors can provide valuable insights for making informed trading decisions.
This is for informational purposes only and does not contain — or to be considered as containing — investment advice, suggestion, or recommendation for trading.