Trading gold is a hot topic today. What`s the point?

Information is not investment advice.
“The desire of gold is not for gold. It is for the means of freedom and benefit” - Ralph Waldo Emerson
For ages, people adore and treasure gold for its natural glow and plasticity. Mankind started using Gold in commerce in the Middle East over 2500 years ago. Nowadays, it is recognized to be the oldest form of money. Gold seems to be a really safe asset. This metal holds good for more than two thousand years despite all wars, cataclysms and global changes.

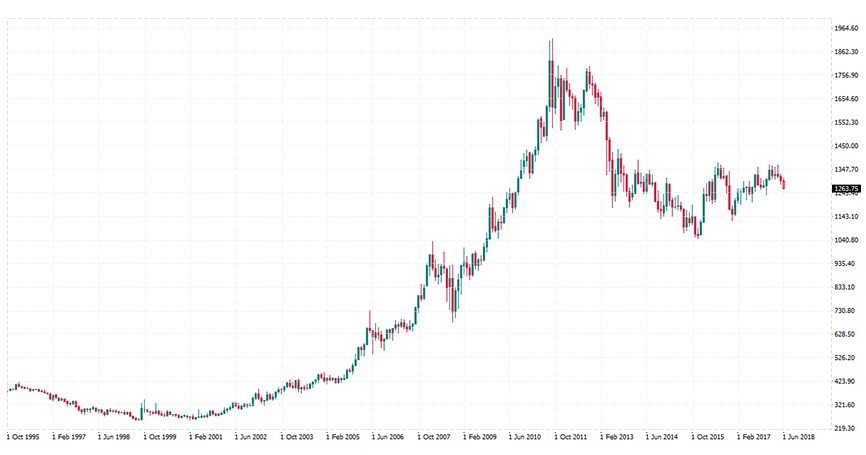
Monthly chart of gold price (XAU/USD, MN).
Though gold sustainable keeps its value, the buy-in of traders has grown and fallen in the past decades. 20 years till the beginning of 2000s gold was overshadowed by strong and skyrocketing economic grows of the stock market. Thus, between 1982 and 2002 its price varied from $300/oz to $500/oz.
During 2000's attention to Gold slowly but surely increased until a real boom of interest during the global financial crisis of 2008. In the late 2011 prices for gold had surged dramatically, breaking the record of $1900. In this article, we will highlight main factors that influence gold prices together with the most widely used trading methods and winning strategies.
Forces that drive gold price
Gold is among the most complex financial assets to value. It is like popular currencies as US dollar and euro due to its stability, strength, convenience and recognition around the world. Yet, opposite to these widely traded currencies, gold is not supported by an underlying economy of workers, companies, and infrastructure.
This means that gold has standardized physical characteristics and is much closer to commodities coming from the ground like oil or corn. But the price of gold frequently varies apart from its industrial supply and demand, in contrast to other commodities.
Major trends in the yellow metal are driven by traders emotions and actions caused by this dynamic. Gold traders are split into two categories. One unites those who believe that gold should cost more than $10000 an ounce, as central banks are debasing their currencies. Another one comprises bearish traders, who are sure that gold price should be closer to $100 as it is an element of the past that won’t be of any use in the present and the future. The first chart shows that gold is losing some of its glow, while its popularity in the mid- and late-2000s looked a bit like a mania.
Gold doesn’t bring you income in form of interest (%). When interest rates in the Unites States – the world’s key economy – rise, demand for gold declines as traders prefer to invest in bonds and other financial instruments. When US interest rates fall, the appeal of gold rises and so does its price. That’s why gold traders need to watch US rates.
How does gold correlate with the US dollar?
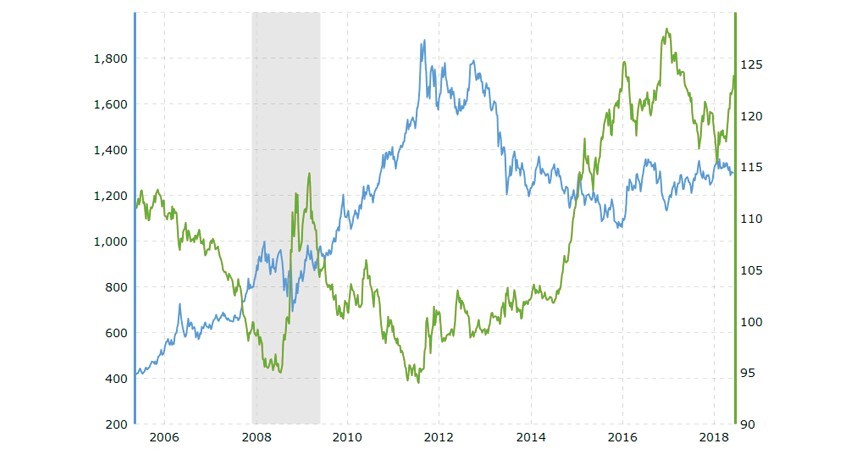
The correlation between gold and the US dollar is the main bone of contention for gold traders. It would be reasonable to consider these assets to be inversely correlated, as gold is priced in US dollars. The price of gold and US dollar moves opposite the one to another. Simply, when the price of the dollar increases, it takes fewer dollars to buy an ounce of gold. And thus, when the price of dollars is lower, it takes more dollars to buy an ounce of gold.
At the same time, the situation is not so simple. It’s true that most of the time the relation between the US dollar and gold described above stands true. However, during the periods of financial crisis, like the one in 2009, and other times of high uncertainty, both gold and the US dollar rise at the same time. It happens because traders consider both of them to be safe investments.
Compare the price of gold with the price of the US dollar: they move mostly in the opposite directions but can rise tigether during the periods of financial stress (the blue line tracks the price of gold, while the green line stands for the US dollar index).

Gold trading strategies
As with any trading tool, one single "best" way to trade gold doesn't exist. Yet, technical trading strategies applied to other trading tools can easily be adapted to the gold market. This especially works with gold’s tendency to form long-lasting trends. This way, many traders succeeded implementing strategies based on trend lines, Fibonacci analysis and overbought/oversold oscillators like RSI and Stochastics.
A short-term strategy: pick a cherry of a trend with a moving average crossover
A typical way to profit from the frequent trends in gold is to use a moving average crossover strategy. According to this strategy, gold is worth buying if a shorter-term moving average crossed above a longer-term moving average. And thus, when the shorter-term moving average crosses below the longer-term average it is better to sell gold.
Traders split in their understanding of the "best" intervals for the two moving averages. One of the good solutions is a crossover of 10-period and 60-period moving averages on the 1-hour chart. Such settings usually allow traders to trade successfully the middle portion of a trend. Though, future performance can't be guaranteed. The way to apply this strategy in the gold market is demonstrated on the chart.
The green line is a 10-hour MA and the blue line is a 60-hour MA. The green line went below the green line at $1,299.45. Together with a break below the previous lows this was a sell signal. Indeed, the price chart went down allowing trader to profit on a sell trade. Then the green line came close to the blue line. If the green line breaks above the blue one, it will be a signal to buy gold.
This trading strategy should help traders to catch the middle portion of trends. Yet, using it when gold has no trend and just stays in a horizontal range may cause a set of continuous losing trades. As a result, traders may wish to build up this strategy with other indicators to improve its long-term profitability.
A long-term strategy: follow the level of real interest rates
Investors and long-term position traders may concentrate on the fundamental factors affecting a price of gold, in particular, on the level of real interest rates. Lower interest rates lead to higher price of gold.
Usually longer-term traders may consider buying opportunities if real yields are below 1%. They use the yield on TIPS as a proxy for real interest rates in the United States. And oppositely, if the yield on TIPS rises above 2%, investors concentrate on sell trades. For sure, this link between real yields and gold prices matters over a longer-term period. Shorter-term gold traders can basically forget the level of interest rates.
A chance to use real interest rates filter is among the unique options that traders can apply to gain an edge when trading gold. All in all, trading the world’s oldest “currency” gives a variety of strategies and endless opportunities.
Trading gold with FBS
FBS gives you an opportunity to profit on gold!
You will find gold under the symbol of XAU/USD in Metatrader. Look up contract specifications for trading gold at FBS website.


