Stocks: Top-5 of what you’ll want to trade

So much better
If you look at the currency charts, they may seem chaotic most of the time. On any timeframe, be it long-term, mid-term, or short-term. The basic reason for that is that a currency quotation reflects the relation between two currencies. In turn, that relation comes from how the two corresponding economies compare to each other. As there are many dynamic factors to take into account, the currency quote rarely follows identical trends over various timeframes. That makes it difficult to predict and to trade currencies.
In the meantime, the price performance of most stocks is normally a steady uptrend. For sure, it has distortions, volatility, and turbulence just as any trading instrument. Nevertheless, in the long-term, it usually an upward trajectory. The reason here is that as long as a company keeps making profits and expands, its stock price will grow in line with the business expansion. That makes the methodology of a stock chart analysis simpler. Eventually, it’s just easier to trade stocks.
As a result, unless you’re really a fan of currencies, analyzing – and, hence, trading – stocks may be much easier and potentially more beneficial for you. Simply put, while it keeps growing, you just stay there and see your position gain value.
The best ones
1000%
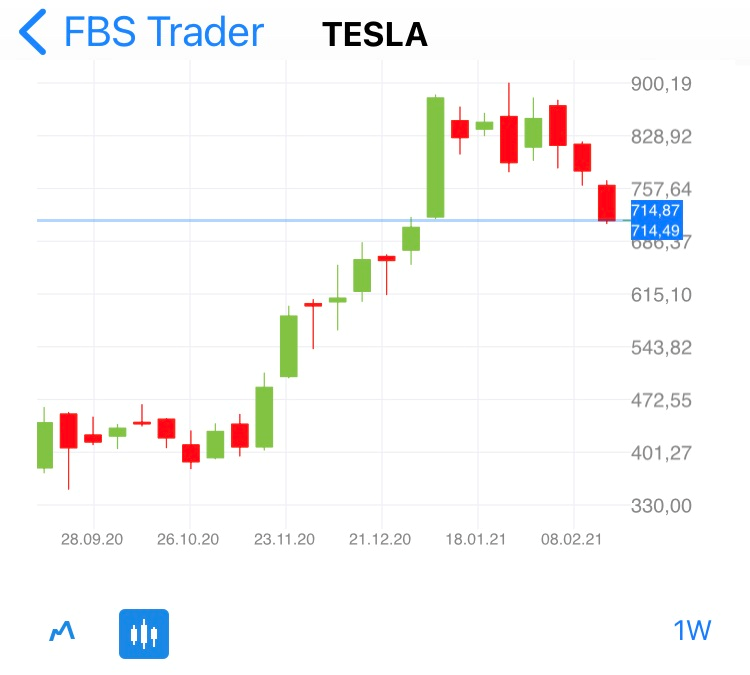
The chart below should be enough reason for you to be interested in trading Tesla. From $90 per share a year ago, it came to roughly $900 now. With all the skepticism and precaution, this stock has a lot of potential because the electrocar industry just started unrolling globally thanks to Elon Musk. Just for your information: while Tesla plans to go for electric cars and ‘robotaxis’ in 2021, there are observers who have set their target for this stock at $1,200 already…
Personality
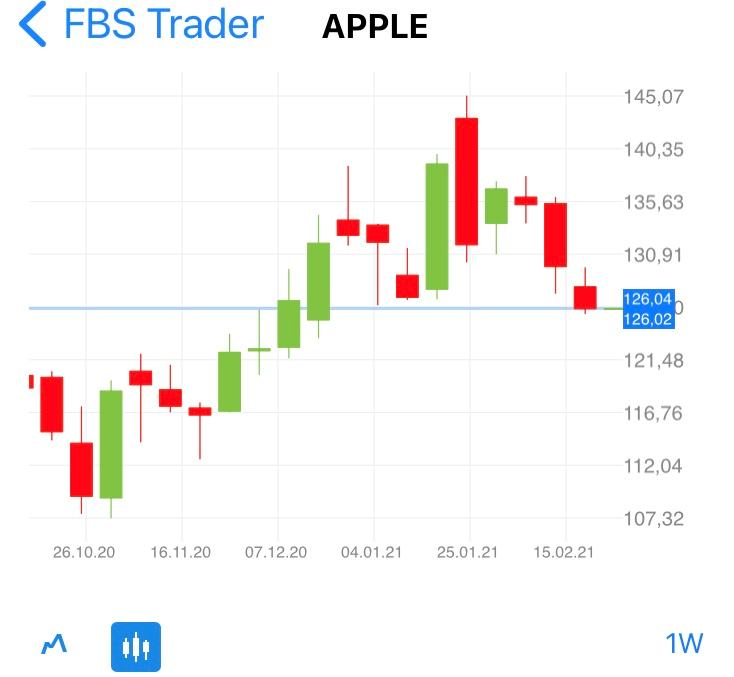
As we said in the beginning, an upward trajectory is what you’ll keep seeing with most stocks. The below chart is for Apple. While it made an almost 200% growth rising from $55 in March 2020 to the current $145, that’s not the point here. The thing is, with currencies, you trade faceless numbers. With stocks, you deal with people. With Tesla, you had Elon Musk. Here, you have Steve Jobs’ legacy. It makes stock trading much more interesting, doesn’t it?
Global presence
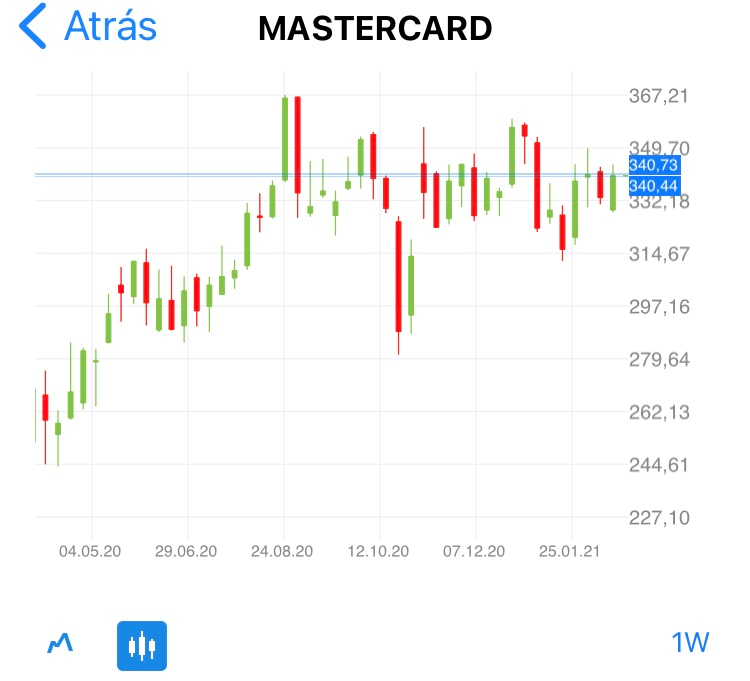
Fundamental analysis is much easier with stocks, too. For example, you may choose a stock based on the global importance of the company it represents. For example, with Mastercard, you are looking at a global clearing and payment processing service. It literally is everywhere where there credit cards or electronic payments are – and it keeps expanding. That’s why 200-to-367 growth in the last 12 months is not the end of the story on this chart.
Even the virus
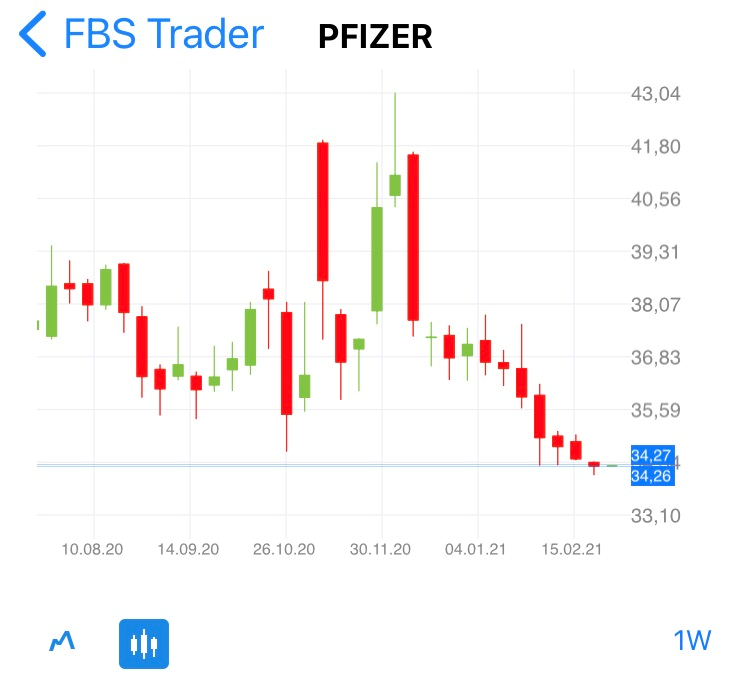
No one will deny that the year 2020 was the year of Covid-19, and the chart below belongs to Pfizer: one of the few pharma companies that gained so much value thanks to vaccine development and already saw its stock price cool off since then. This chart is interesting for both technical and fundamental reasons: you hear Pfizer being successful – you see the stock surge; you see it drop down to a tactical support level – expect a reversal to the upside. Very convenient if you like staying informed and apply visuals in your trade.
Relaxation time
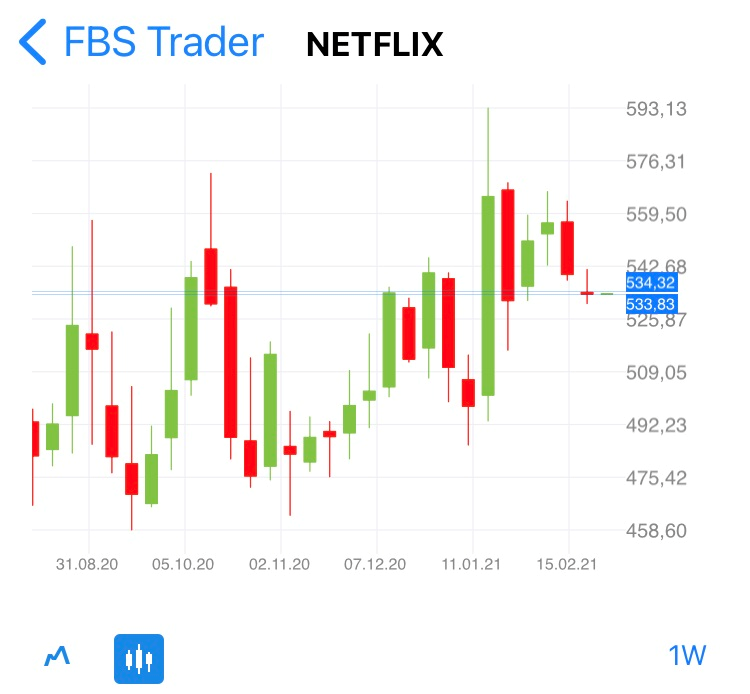
Finally, stocks you trade represent things you have around in your life. For example, if you eat at McDonald’s sometimes – you can trade that stock with FBS. Drink Coca-Cola? You can trade that, too. Order on Amazon? Also, available. Below, you have the chart of Netflix stock price performance. Do you watch Netflix? No worries, if you don’t. You can still trade Netflix stock: a “humble” 100% value growth is what it had in 2020.
