
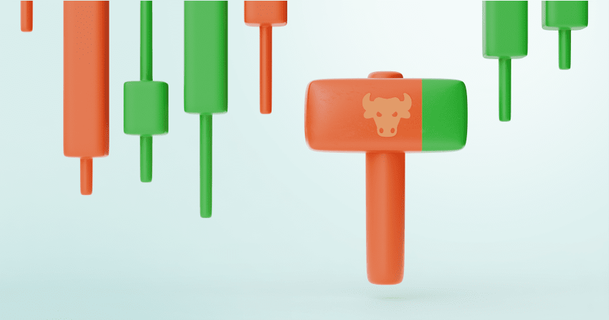
Hammer Candlestick Pattern
Many traders use Japanese candlestick charts to analyze the price of an asset…

Don’t waste your time – keep track of how NFP affects the US dollar!
Data Collection Notice
We maintain a record of your data to run this website. By clicking the button, you agree to our Privacy Policy.

Beginner Forex Book
Your ultimate guide through the world of trading.

Check Your Inbox!
In our email, you will find the Forex 101 book. Just tap the button to get it!
Risk warning: ᏟᖴᎠs are complex instruments and come with a high risk of losing money rapidly due to leverage.
70.72% of retail investor accounts lose money when trading ᏟᖴᎠs with this provider.
You should consider whether you understand how ᏟᖴᎠs work and whether you can afford to take the high risk of losing your money.
Warning! Old version of the browser!
Press one of the icons below to proceed to the official website of the developer and download the latest version of your browser.

Online Forex broker
Ways to improve your trading skills
Information is not investment advice
Many traders use Japanese candlestick charts to analyze the price of an asset…
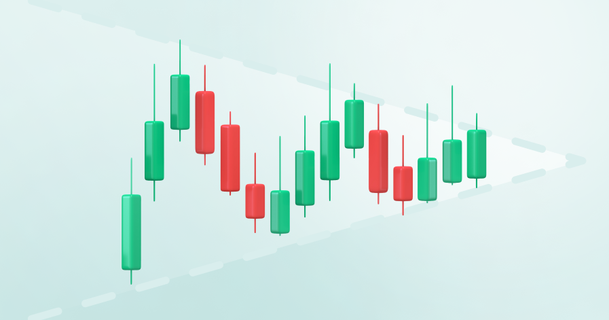
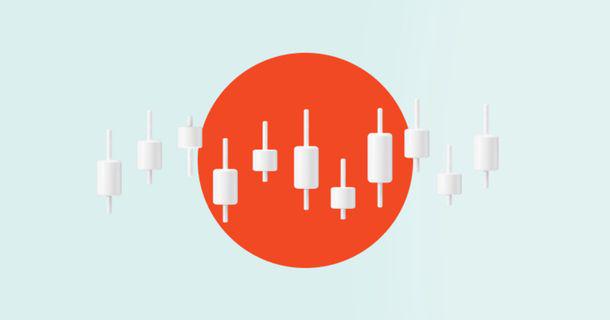
A triangle chart pattern is a consolidation pattern that involves an asset price moving within a gradually narrowing range.
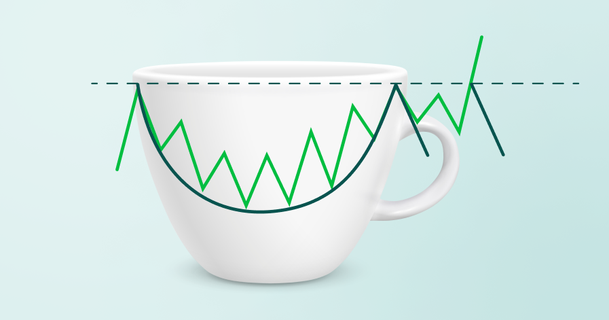
A Cup and Handle price pattern is a technical chart setup that resembles a cup with a handle.
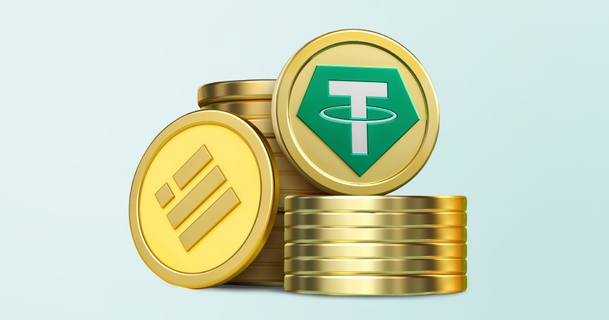
According to coinmarketcap.com, there are more than 9250 different cryptocurrencies. And those are registered ones, with twice as much hidden from view. An article describing them would take a year to read and won’t make any sense as half of these cryptocurrencies are already inactive.
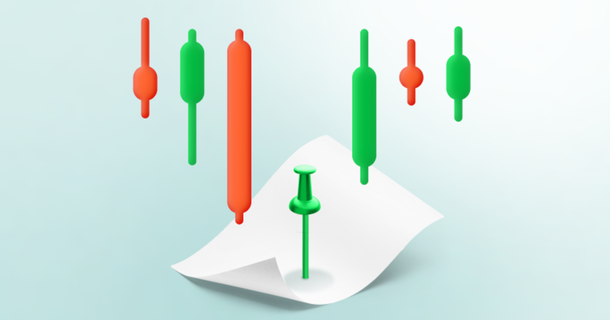
Sometimes a chart or a candlestick pattern may provide a decent entry signal if it is located at a certain level. A pin bar is one of the most reliable and famous candlestick patterns, and when traders see it on the chart, they expect the price to change its direction soon.
Have you ever wondered how many wonderful tools did Japanese people invent? QR codes, car navigation, instant noodles, and sushi are just some of the Japanese things we can't imagine our life without.
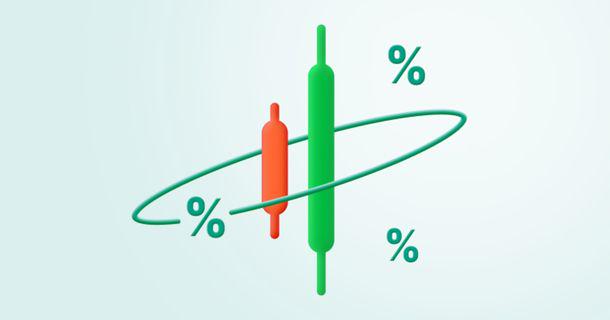
Among hundreds of different indicators and technical tools for traders, the relative strength index (RSI) is one of the most popular due to its simplicity and, at the same time, its power in various trading cases. In this article, we want to tell you about another powerful tool similar to RSI but with some cool tweaks.
There are a lot of valuable strategies that require the knowledge of candlestick patterns and oscillators. However, not of them are profitable. When you start trading with them, you can face situations when the strategy is not moving your way.
Intraday trading, also known as day trading, is about buying and selling assets on the same day.
Most traders prefer to trade using technical indicators like RSI and MACD. Others love using a bare chart to make their decisions.
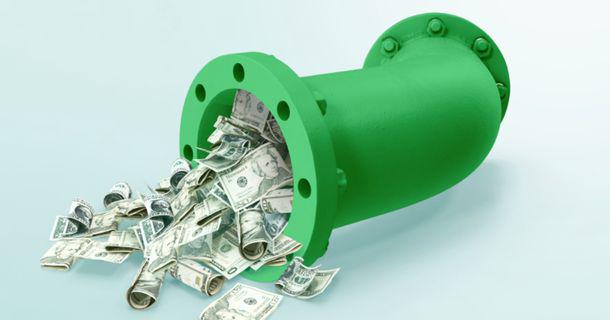
One of the most important elements of successful Forex trading is money management.

Based on the current economic changes, our long-term vision, and stocks’ performances, we have created for you a list of top stocks to trade this month.
Your request is accepted.
We will call you at the time interval that you chose
Next callback request for this phone number will be available in 00:30:00
If you have an urgent issue please contact us via
Live chat
Internal error. Please try again later