


Williams’ Strategy
Bill Williams is the creator of some of the most popular market indicators: Awesome Oscillator, Fractals, Alligator, and Gator.

Don’t waste your time – keep track of how NFP affects the US dollar!
Data Collection Notice
We maintain a record of your data to run this website. By clicking the button, you agree to our Privacy Policy.

Beginner Forex Book
Your ultimate guide through the world of trading.

Check Your Inbox!
In our email, you will find the Forex 101 book. Just tap the button to get it!
Risk warning: ᏟᖴᎠs are complex instruments and come with a high risk of losing money rapidly due to leverage.
70.72% of retail investor accounts lose money when trading ᏟᖴᎠs with this provider.
You should consider whether you understand how ᏟᖴᎠs work and whether you can afford to take the high risk of losing your money.
Warning! Old version of the browser!
Press one of the icons below to proceed to the official website of the developer and download the latest version of your browser.

Online Forex broker
2020-12-10 • Updated
Information is not investment advice
If you are familiar with trading, you probably know the basics of fundamental and technical analysis. Generally speaking, fundamental analysis answer to the question “Why does the market move?” and technical analysis tries to find out “When will the price movement occur?” However, you may not know the type of analysis, which combines both fundamental and technical practices. This approach is called VSA (volume spread analysis) and it is widely used by the stock traders. Here we will explain to you how the VSA may be applied to Forex trading.
VSA was invented by Richard D. Wyckoff, who started to trade stocks at the age of 15. At the end of XX century, Tom Williams improved the Wyckoff’s research and developed his own methodology. In his book called “Master the Markets”, he mentioned the importance of the price differences (spreads) connected with volumes and the closing price.
So what the VSA is about? Volume spread analysis is the type of analysis based on volumes and the spread of the candlestick. It tries to find out the differences between supply and demand, which the biggest players create in the Forex market (professional traders, institutions, banks and market makers). If you know how to understand their actions, they may give you good signals to enter the market.
You need to determine three main variables to find out the balance between supply and demand. They are, as follows:
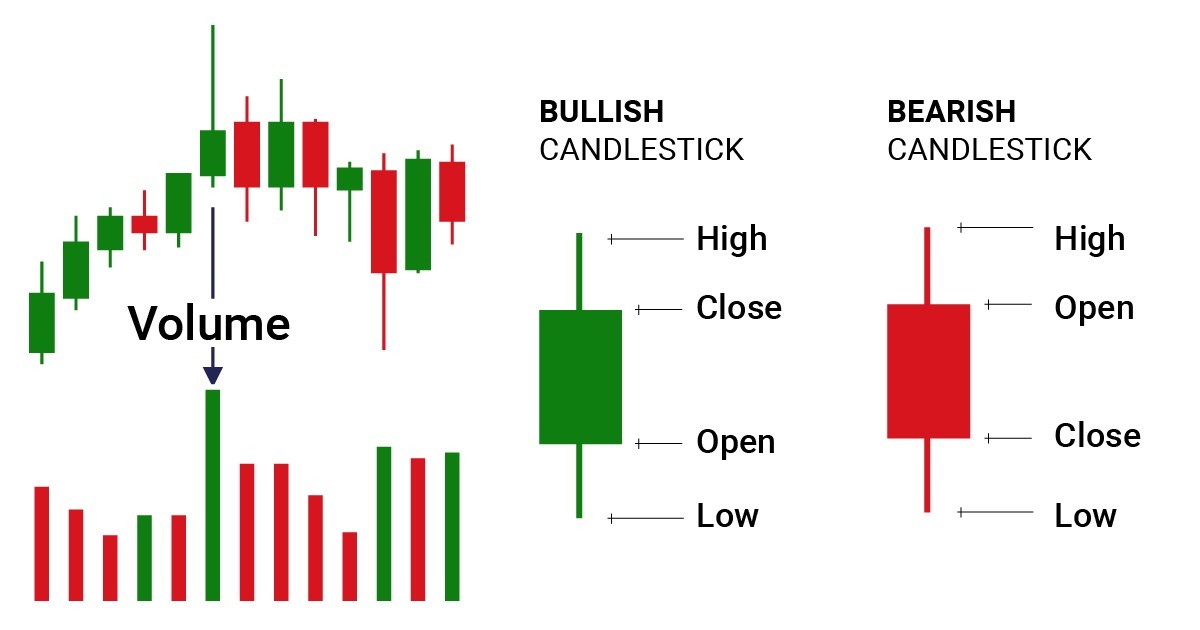
Volumes are usually underestimated by the newbies, however, it is an important element of the market analysis. The volume shows the transaction amounts while the range of the price demonstrates the movement in relation to the volume.
Based on these elements, trader may understand the current phase of the market. We can identify four of these stages, according to Mr. Wyckoff:
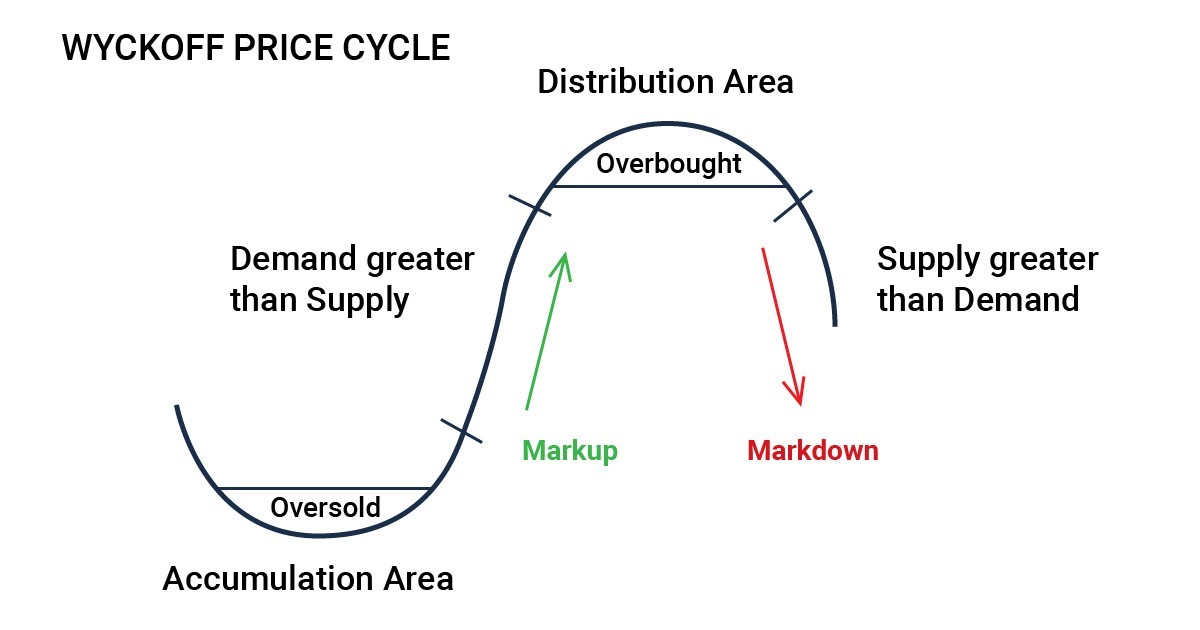
As we know, Richard D. Wyckoff used this analysis to trade stocks, but how the Forex trader may apply it on practice? Let’s find out.
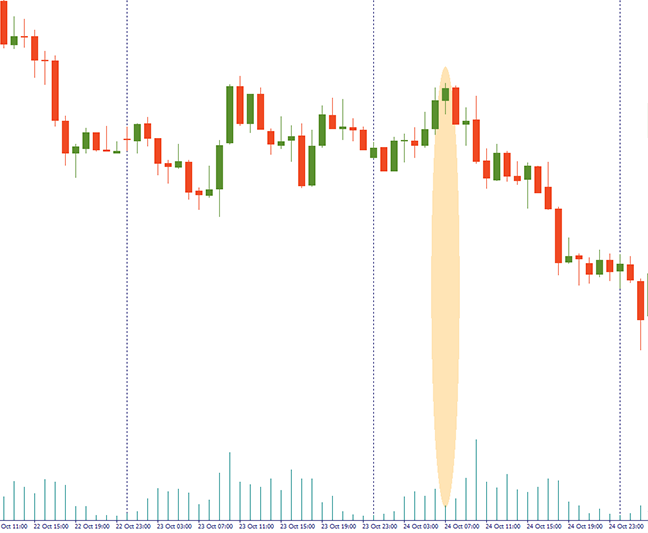
There are huge debates among traders on whether the VSA can be used in the Forex market. The reason for it is that the Forex market is decentralized, unlike the stock one. As a result, actual volumes are not available. However, you may analyze the market by looking at the volume observed in each bar.
In MT4, you just need to right-click on the chart and press “Volumes” to see them. Also, you can press Ctrl+L on your keyboard.
There are a lot of different interpretations of the VSA, which makes it difficult to understand it for a beginner trader. Here, we are going to introduce to you some of the most commonly used models of the VSA, according to Tom Williams, which may help you to trade with professional players.
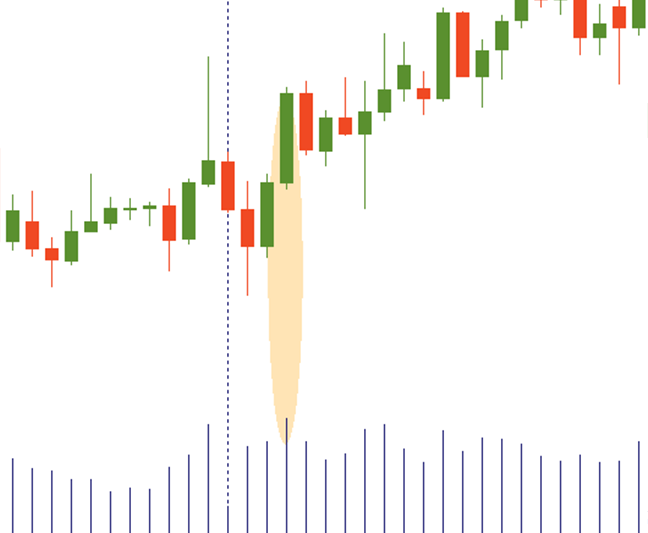
1st model – The bullish bar with a regular size. The price closed near the high. The volume is higher than the average in 15-20 days and, most importantly, higher than in the previous bar.
This model shows that the demand is increasing and the rise will continue.
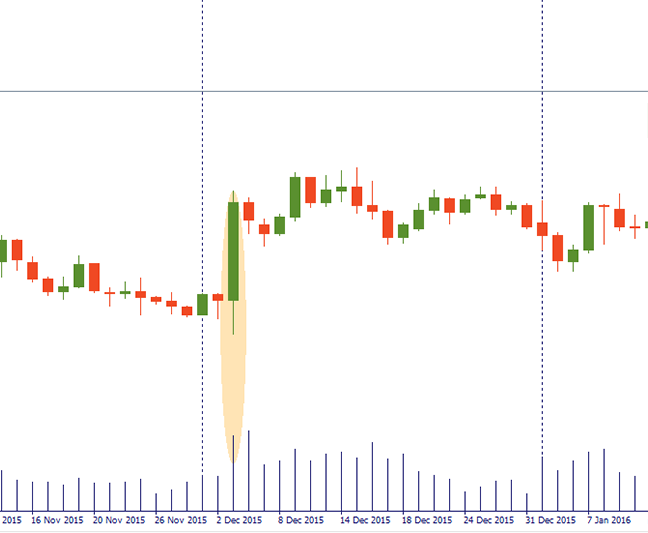
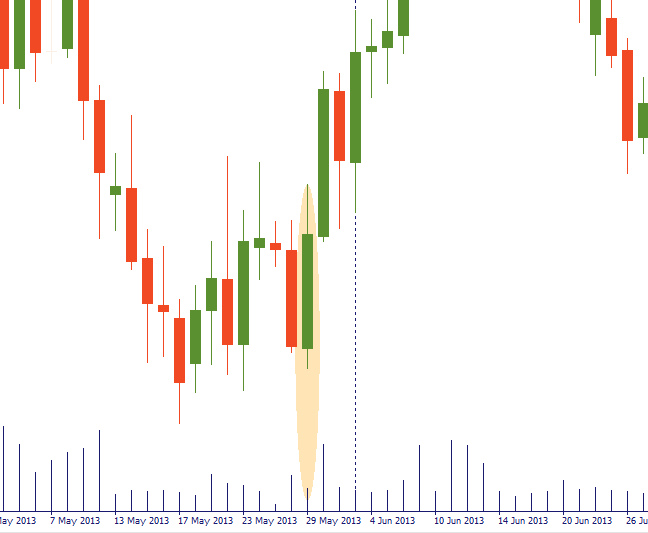
2nd model – Bullish/bearish candlestick (Bullish gives a stronger signal). It updated the minimum. The size is bigger than usual. The closing price is placed close to the high. High volume.
This model signals a possible reversal.
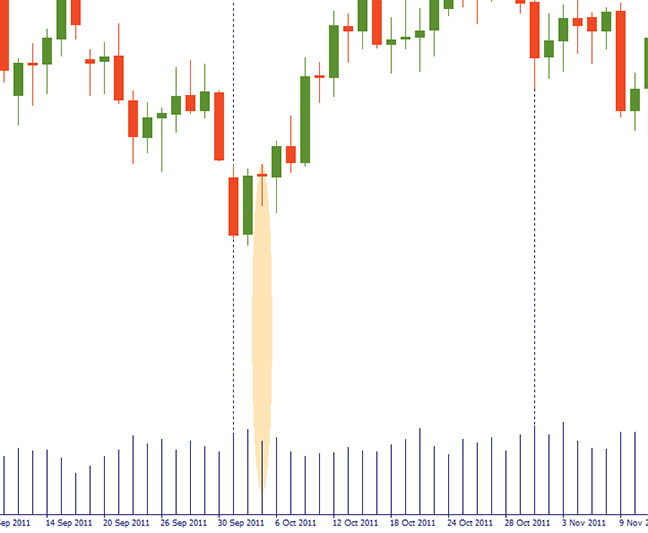
3rd model – Bullish/bearish candlestick (Bullish gives a stronger signal). It updated the minimum. The size of the candlestick is big and the closing price is placed close to the high. Low volume.
It shows that professional players do not support the bearish market anymore.
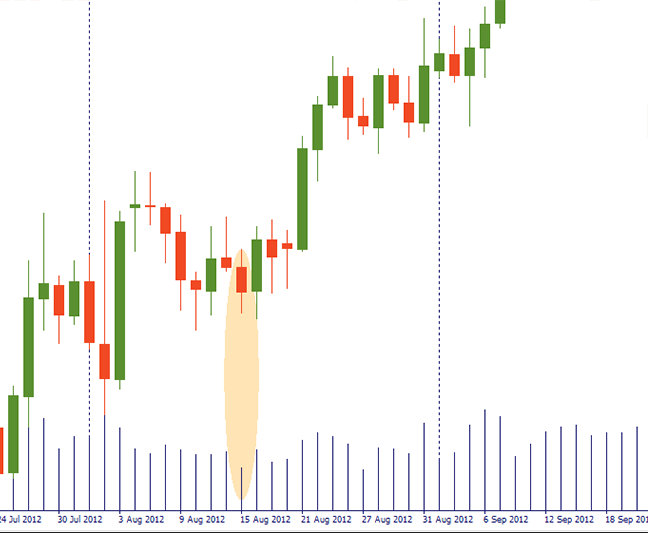
1st model – Small size of the candlestick. The closing price is placed close to the high. High volumes.
Major market players cover all the supply. Bears don’t have enough strength to overcome the opening price.
2nd model – Bearish candlestick. It has a small size and a small volume. The closing price is placed close to the low.
This model shows the absence of sellers in the market.
1st model – Bullish bar. It has a small size. The closing price is close to the low of the candlestick. High volumes. Occurs during the uptrend.
This is a sign of strong selling pressure.
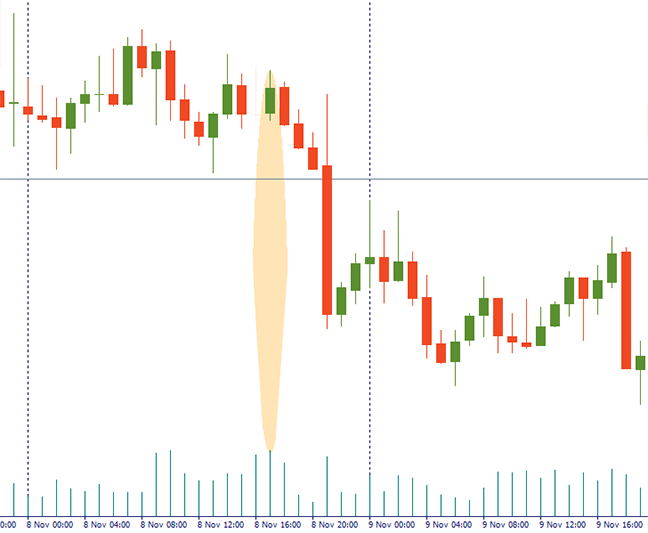
2nd model – Bullish bar, small size, low or extremely low volume. Occurs during the downtrend.
This model may signal the possible end of correction amid the downward trend.
Tom Williams listed even more examples, but don’t follow them blindly and check twice before making trading decisions.
Conclusion
The volume spread analysis helps to understand the behavior of the market, based on the volumes and the analysis of the candlesticks. However, you need to apply this analysis very carefully and take into account all the variables.

Bill Williams is the creator of some of the most popular market indicators: Awesome Oscillator, Fractals, Alligator, and Gator.

Trend strategies are good - they may give significantly good results in any time frame and with any assets. The main idea of the ADX Trend-Based strategy is to try to catch the beginning of the trend.

Counter-trend strategies are always the most dangerous but also the most profitable. We are pleased to present an excellent counter-trend strategy for working in any market and with any assets.


Your request is accepted.
We will call you at the time interval that you chose
Next callback request for this phone number will be available in 00:30:00
If you have an urgent issue please contact us via
Live chat
Internal error. Please try again later