


Williams’ Strategy
Bill Williams is the creator of some of the most popular market indicators: Awesome Oscillator, Fractals, Alligator, and Gator.

Don’t waste your time – keep track of how NFP affects the US dollar!
Data Collection Notice
We maintain a record of your data to run this website. By clicking the button, you agree to our Privacy Policy.

Beginner Forex Book
Your ultimate guide through the world of trading.

Check Your Inbox!
In our email, you will find the Forex 101 book. Just tap the button to get it!
Risk warning: ᏟᖴᎠs are complex instruments and come with a high risk of losing money rapidly due to leverage.
70.72% of retail investor accounts lose money when trading ᏟᖴᎠs with this provider.
You should consider whether you understand how ᏟᖴᎠs work and whether you can afford to take the high risk of losing your money.
Warning! Old version of the browser!
Press one of the icons below to proceed to the official website of the developer and download the latest version of your browser.

Online Forex broker
2022-06-08 • Updated
Information is not investment advice
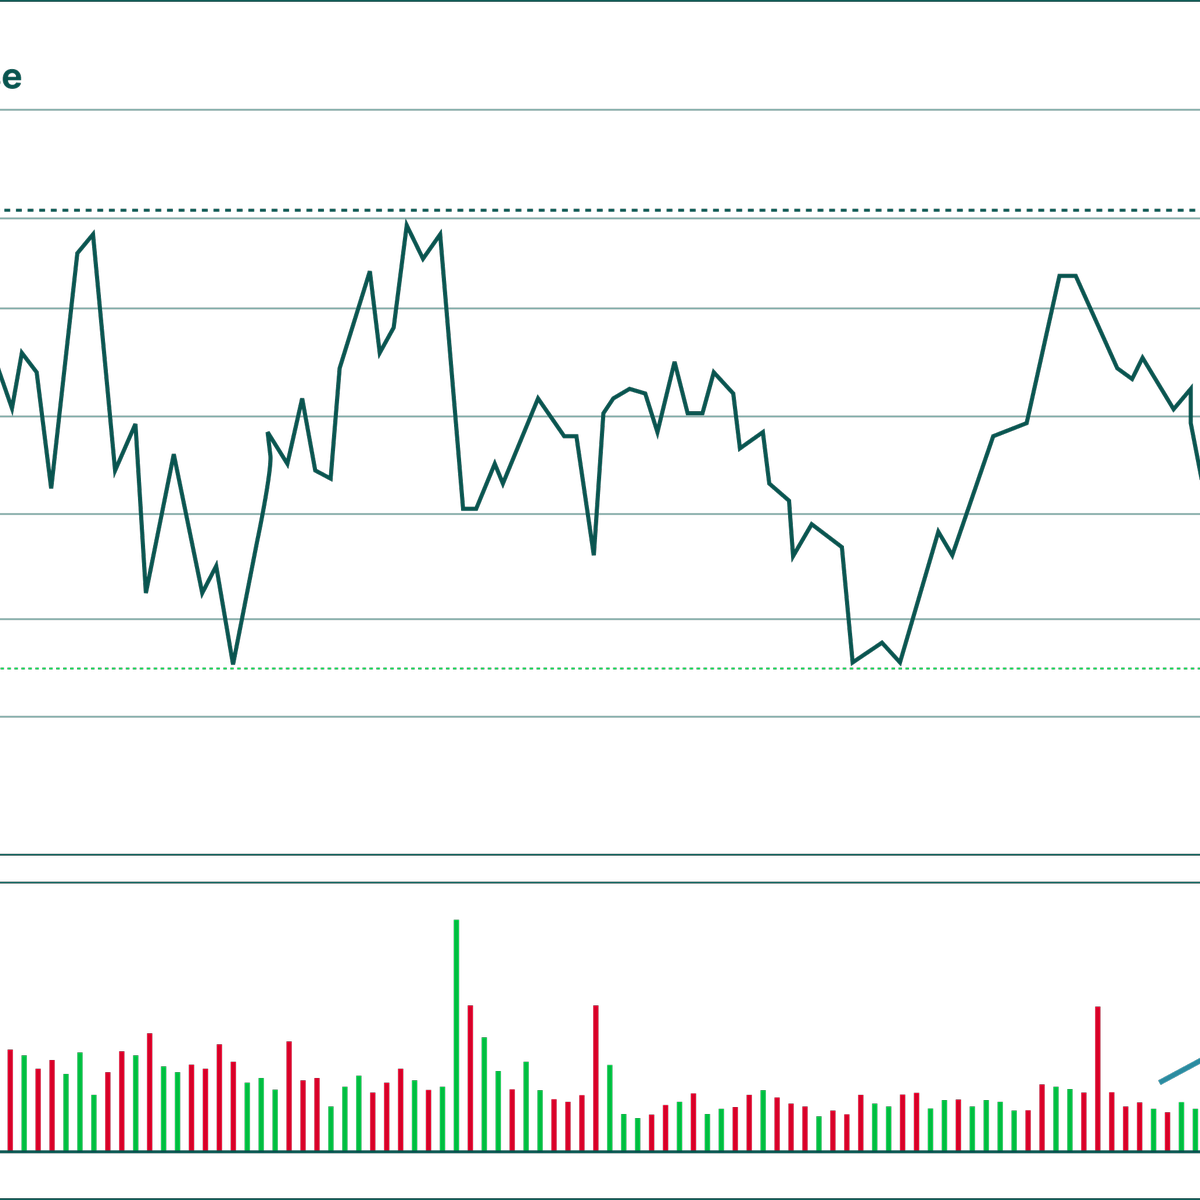
In trading, the term "volume" represents the amount of money that has been spent for buying or selling a particular asset over a specific period. Traders rely on it as a key metric because it lets them know what an asset's liquidity level is.
Volume analysis is a technique used to determine the trades you will make by discovering the relationships between volume and prices.
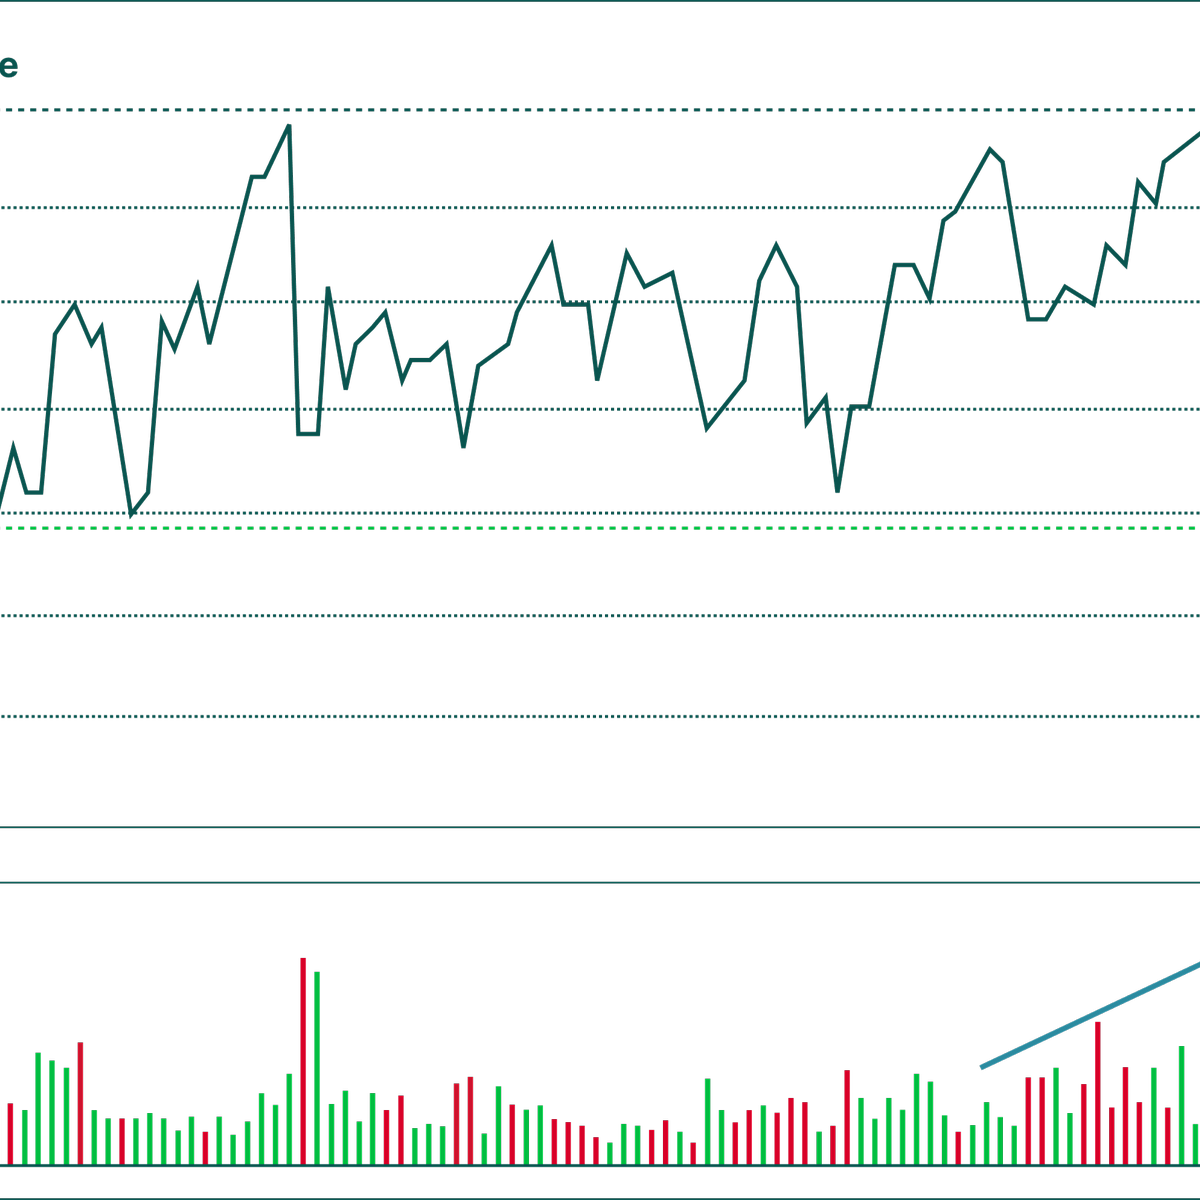
At some point, a price meets a resistance level during uptrends and in sideways markets. The trend stops and starts to fizzle as selling pressure overcomes buying pressure. When a price breaks through that level, the breakout will be more significant if the volume is high or above average. A breakout accompanied by low volume suggests enthusiasm for the move may be lacking.
An uptrend combined with an increasing and/or above-average volume shows an investor's enthusiasm for that asset, leading to more buying and even higher prices.
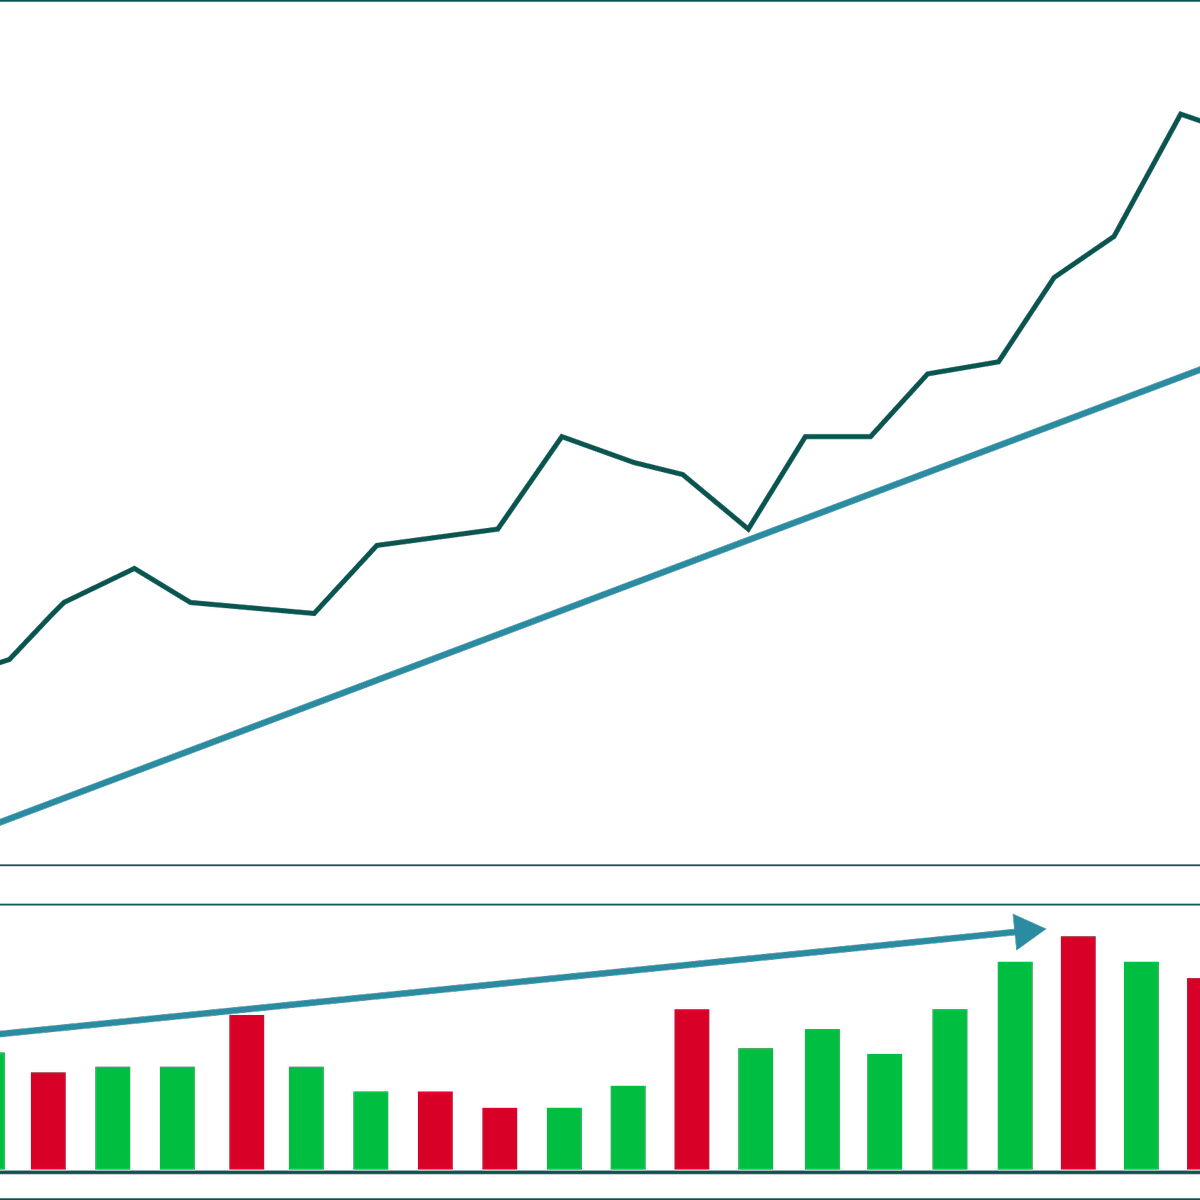
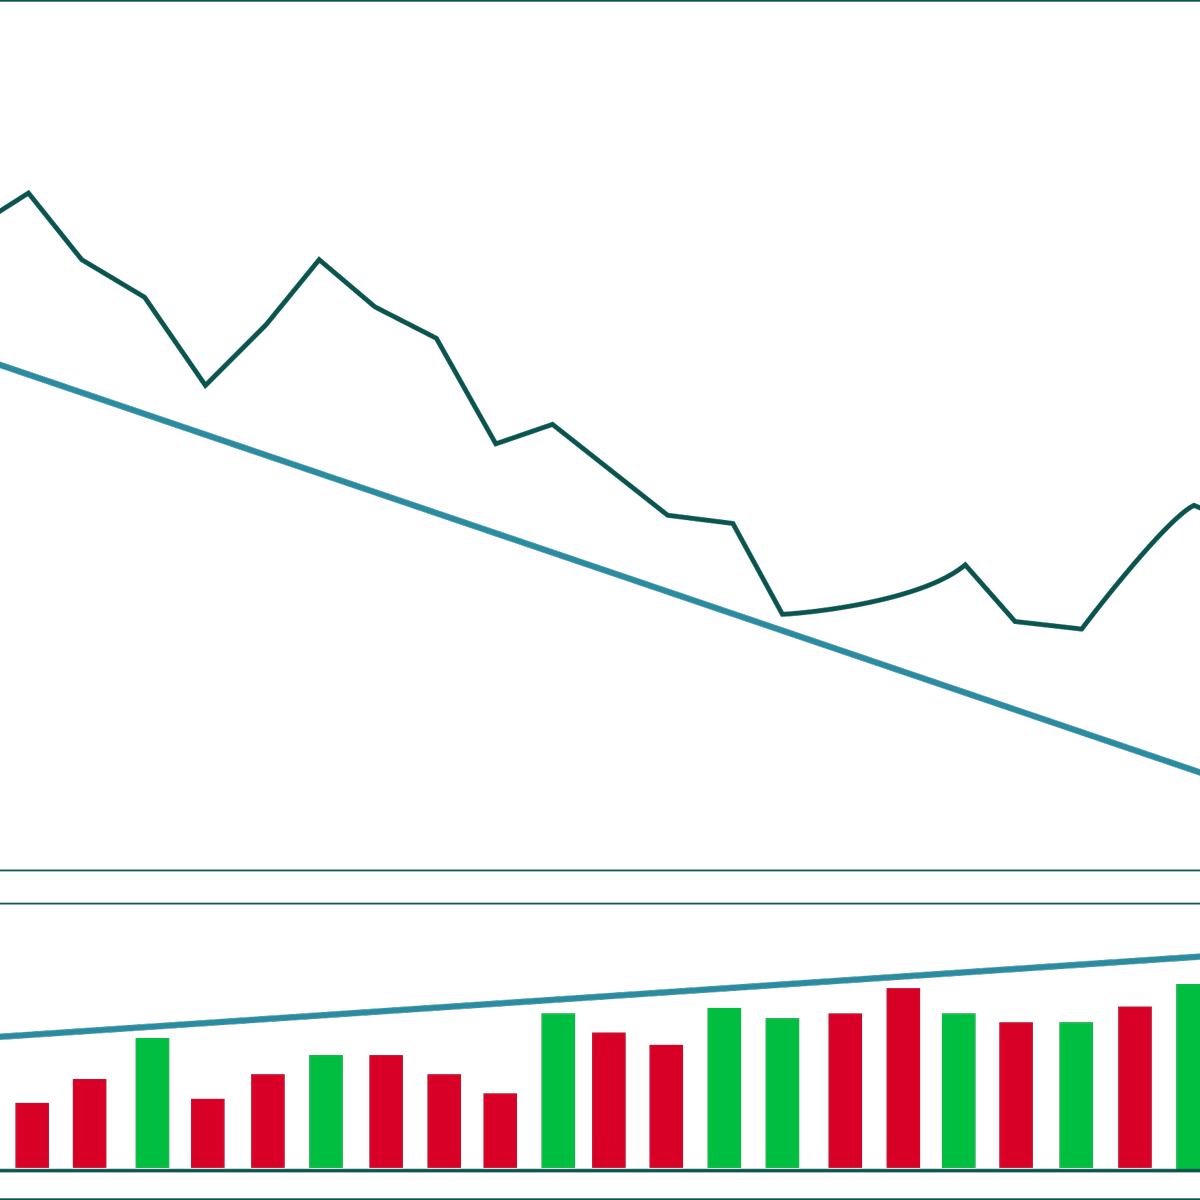
An uptrend without increasing and/or above-average volume suggests a limited investor's enthusiasm, which signals an upcoming reversal.
At some point, a price meets a support level during downtrends and in sideways markets. The trend stops and starts to fizzle as buying pressure overcomes selling pressure. When a price breaks through that level, the breakout will be more significant if the volume is high or above average. A breakout accompanied by low volume suggests low enthusiasm for the move.
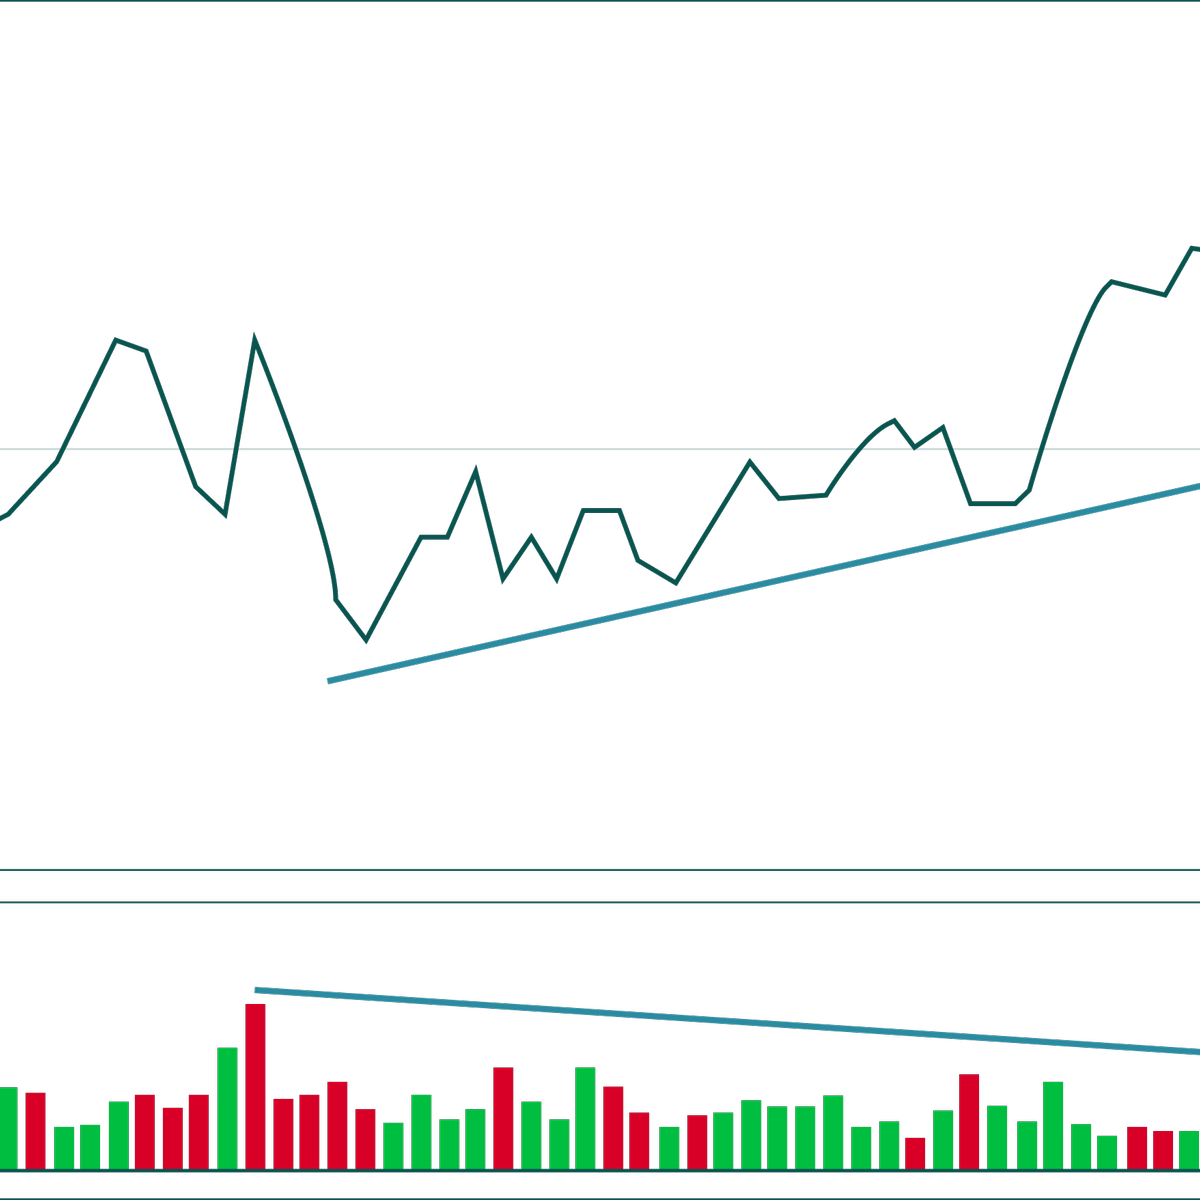
A downtrend accompanied by increasing and/or above-average volume implies investors have doubts about the stock, which could lead to more selling and even lower prices. This is a great time for making sell trades.
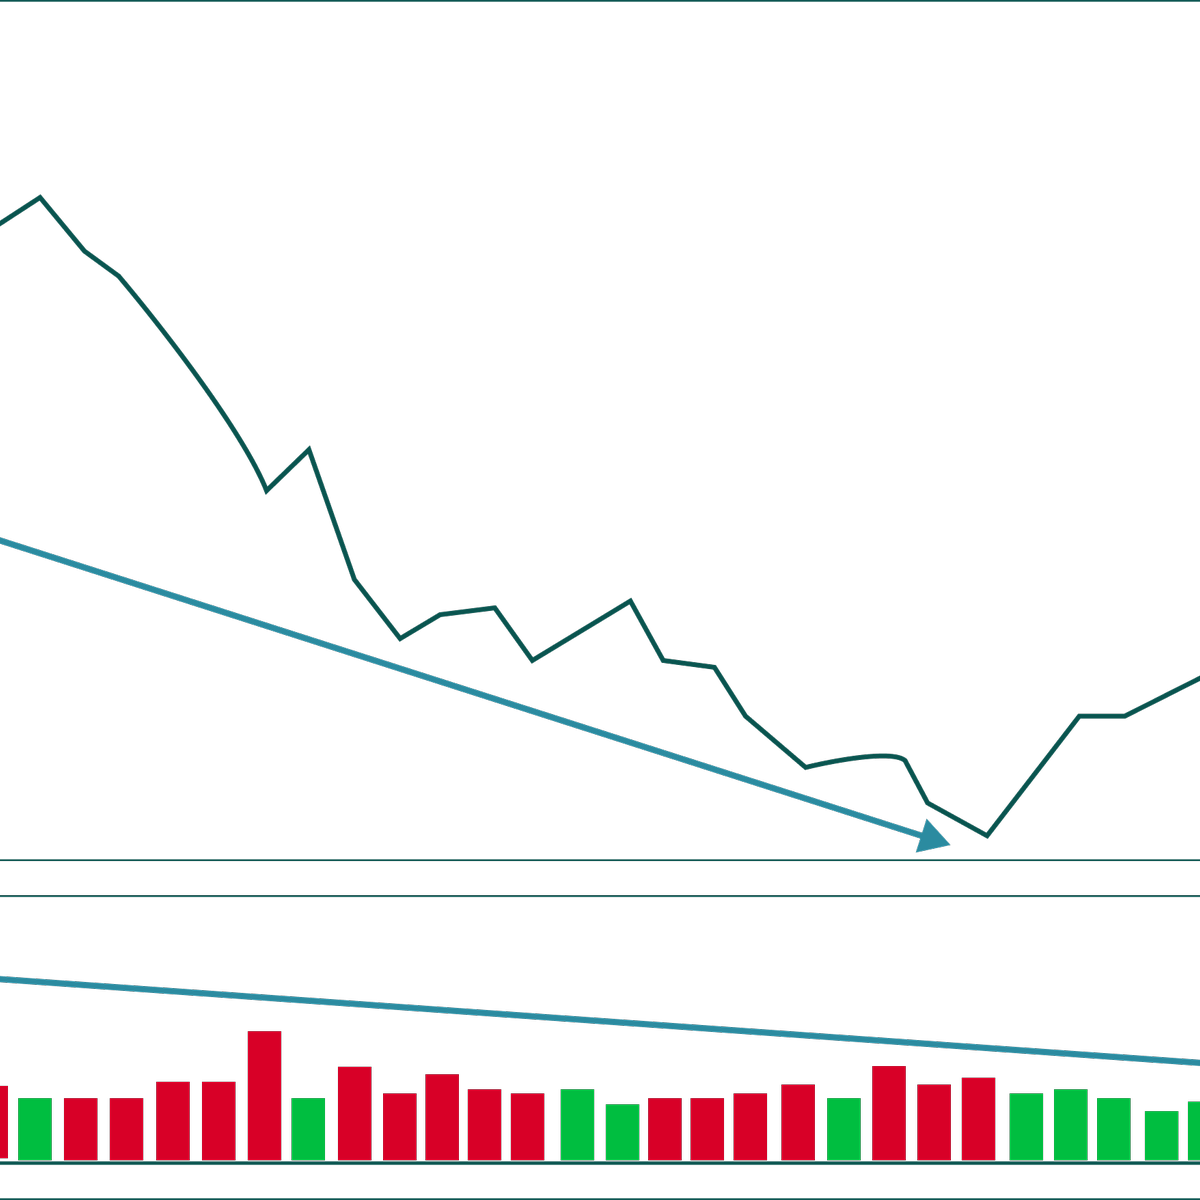
A downtrend without increasing and/or above-average volume implies limited investors’ concerns. While the price continues to fall, volume analysis traders may start watching for signs of an upcoming reversal supported by increasing volume.
As a rule of thumb, any price breakout or trend accompanied by above-average volume could be considered more significant than price movements that are not.
Volume indicators are mathematical formulas visually represented in the most commonly used charting platforms. Each indicator uses a slightly different formula, and traders should find the indicator that works best for their particular market approach.
There are many volume indicators to choose from, and the following provides a sampling of how traders can use several of them.
On Balance Volume (OBV) measures buying and selling pressure. It’s a cumulative indicator that adds volume on up days and subtracts volume on down days. When the asset closes higher than the previous close, all of the day’s volume is considered up-volume. When the security closes lower than the previous close, all of the day’s volume is considered down-volume. The actual value of the OBV is unimportant; concentrate on its direction.
Chaikin Money Flow (CMF) is a volume-weighted average of accumulation and distribution over a specified period. The standard CMF period is 21 days. The principle behind the Chaikin Money Flow is the nearer the closing price is to the high, the more accumulation has taken place. Conversely, the nearer the closing price is to the low, the more distribution has taken place. If the price action consistently closes above the bar's midpoint on increasing volume, the Chaikin Money Flow will be positive. Conversely, if the price action consistently closes below the bar's midpoint on increasing volume, the Chaikin Money Flow will be a negative value.
The Klinger Oscillator is a financial tool that predicts long-term trends in money flow while detecting short-term fluctuations. In addition, it predicts price reversals in a financial market by extensively comparing volume to price.
As mentioned above, the Klinger Volume Oscillator consists of two lines and the centerlines. Usually, the two lines are usually red and blue. The blue line is the signal, while the red line is the Klinger.
As with most indicators with two lines, the key points to watch are when a crossover happens between the two lines. Another level to watch is when the two lines pass the centerline.
A buy signal usually appears when there is a crossover between the two lines below the centerline. On the other hand, a sell signal forms when there is a crossover between the two lines above the centerline.
Volumes have always been a significant indicator of the market’s sentiment. Just as Aroon or RSI indicators, volumes can help a trader confirm a breakout, spot an upcoming reversal, and find the price accumulation. Adding volumes to your trading strategy will improve trading results and decrease the number of mistakes.

Bill Williams is the creator of some of the most popular market indicators: Awesome Oscillator, Fractals, Alligator, and Gator.

Trend strategies are good - they may give significantly good results in any time frame and with any assets. The main idea of the ADX Trend-Based strategy is to try to catch the beginning of the trend.

Counter-trend strategies are always the most dangerous but also the most profitable. We are pleased to present an excellent counter-trend strategy for working in any market and with any assets.


Your request is accepted.
We will call you at the time interval that you chose
Next callback request for this phone number will be available in 00:30:00
If you have an urgent issue please contact us via
Live chat
Internal error. Please try again later