


Williams’ Strategy
Bill Williams is the creator of some of the most popular market indicators: Awesome Oscillator, Fractals, Alligator, and Gator.

Don’t waste your time – keep track of how NFP affects the US dollar!
Data Collection Notice
We maintain a record of your data to run this website. By clicking the button, you agree to our Privacy Policy.

Beginner Forex Book
Your ultimate guide through the world of trading.

Check Your Inbox!
In our email, you will find the Forex 101 book. Just tap the button to get it!
Risk warning: ᏟᖴᎠs are complex instruments and come with a high risk of losing money rapidly due to leverage.
66.43% of retail investor accounts lose money when trading ᏟᖴᎠs with this provider.
You should consider whether you understand how ᏟᖴᎠs work and whether you can afford to take the high risk of losing your money.
Warning! Old version of the browser!
Press one of the icons below to proceed to the official website of the developer and download the latest version of your browser.

Online Forex broker
2024-03-26 • Updated
Information is not investment advice
Every month on the first Friday of the new month, the US Department of Labor releases data on the employment rate and the number of people employed in non-agricultural sectors of the economy. So why is it so important?
First, high unemployment leads to social tensions, eventually leading to unrest and a violent takeover of power. High unemployment promotes the rise to power of various radical politicians.
Second, it is the effect of unemployment on production and, consequently, on economic growth (GDP growth).
Third, unemployment reduces the flow of taxes into the budget and increases government spending, including, for example, unemployment benefits and social obligation payments.
In the United States, the unemployment rate is calculated with the number of people employed in the nonfarm payroll. This article will discuss how this calculation is done and what you must look for to analyze the unemployment rate.
The unemployment rate is calculated through surveys of about 60 000 families by the Ministry of Labor. Both agricultural and nonagricultural workers are interviewed. A calculation is then made using the following simple formula:

Economists agree that a normal unemployment rate is 4-5%. As can be seen, in the United States, since the end of the mortgage crisis, the unemployment rate has continued to fall and reached its historic low in February 2023 (3.4%).
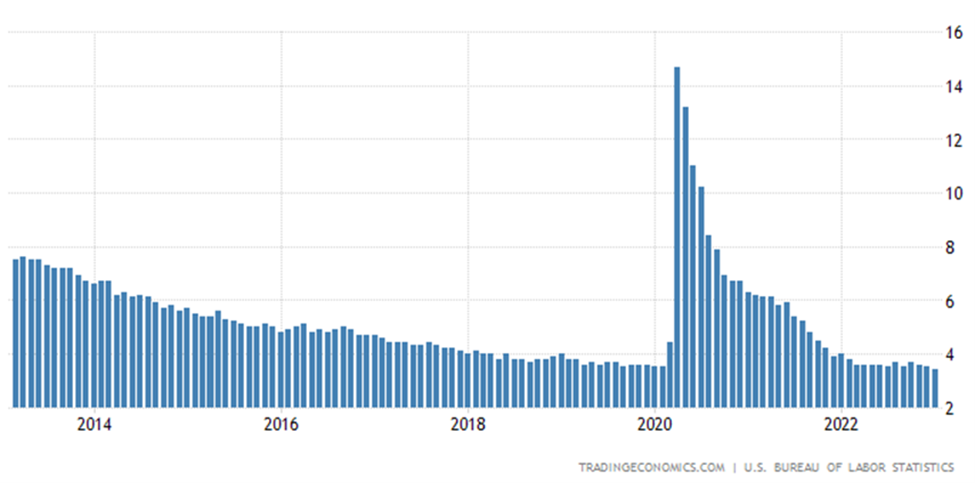
Here we should remember that the US Department of Labor only counts people actively looking for work as unemployed. People who cannot change their situation are not counted in the unemployment rate.
Nonfarm Payrolls (NFP) is also calculated through surveys. This time, however, 440 000 companies with more than 50 million workers are being surveyed. Thus, how much does the number of people employed in companies increase or decrease?
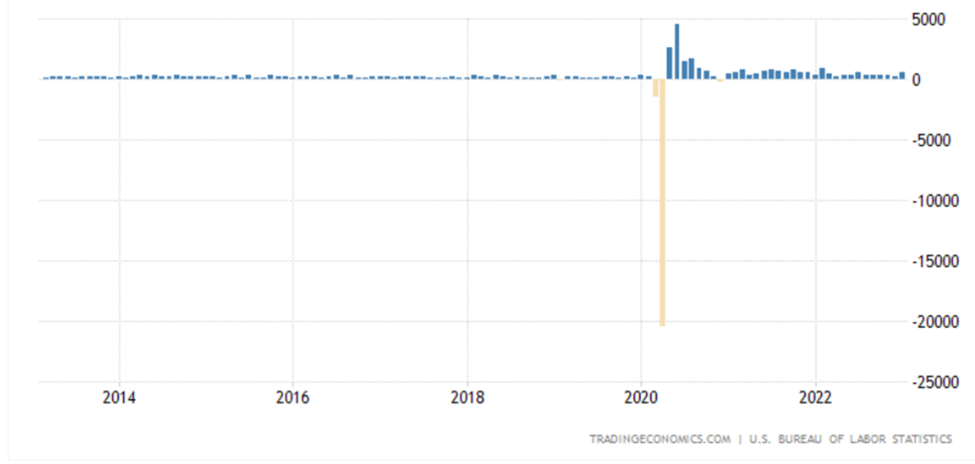
What number of NFPs is considered "normal"? Of course, the general criterion is as follows - the more the better. More labor means stronger economic growth, which often leads to higher inflation. But about that, another time. According to various estimates by economists, with normal development of the American economy (3-4% per year), the number of jobs created should be at least 150 000 per month.
If you pay attention to the NFP figure, you can see how badly the crisis years have affected employment results (the figure was negative).
The US economy is very complex and "rich" in different statistics. Along with the unemployment rate and nonfarm payrolls, several other indicators are desirable to pay attention to.
Leaving aside the calculation of different NFP indicators for other groups (e.g., NFP for government workers and NFP for the private sector), the most relevant indicators are average hourly earnings, average workweek, and the percentage of the economically active population.
The growth of average hourly earnings leads to an increase in consumer spending, which increases consumption and, consequently, economic growth. Therefore, this indicator can significantly impact the market situation.
The Average Workweek, as the name implies, measures how many hours workers work during a week on average. An increase in the average workweek is considered an indicator of economic growth, while a decline is likely to lead to corporate layoffs.
The share of the economically active population reflects the number of people who have or wish to have a source of livelihood. In fact, these are people between the ages of about 15 and 70, who may be both employed and unemployed. Consequently, the growth of the economically active population is, of course, good for the economy.
Of course, even before the Unemployment Rate and Nonfarm Payrolls are released, a block of unemployment statistics is released in the US, affecting the consensus forecast. This article will explain what we need to pay attention to understand if the consensus forecast is reasonable.
Estimate: the higher the number of applications for unemployment benefits, the worse the employment situation is. Consequently, if the number of monthly applications increases, we should hardly expect a positive unemployment rate.
Estimate: the more people are cut, the higher the unemployment rate. The connection is quite apparent. Unfortunately, however, it is tough to assess what number of people to be cut is "normal" and what number is "above the norm. We suggest keeping an eye on the "surge" indicator. If there is a significant number of redundancies, we can say that the unemployment rate is unlikely to go "down.
Estimate: the higher the index of job announcements, the lower the unemployment rate. It seems logical to track the indicator in dynamics. The fact is that the growth of the vacancy rate is not immediately reflected in the unemployment rate. The interview and hiring procedures take some time (one or two months).
Estimate: this is one of the most controversial indicators, which raises many questions. Before the nonfarm payroll figure is released, a preliminary assessment from Automatic Data Processing Inc. (ADP) is released the day before publication (Wednesday). The report is generated by evaluating about 340,000 companies and 21 million workers. Unfortunately, the data from the ADP report and the US Department of Labor often do not match up.
Knowing how to forecast Nonfarm payrolls numbers will give you a powerful tool in your market analysis.
Legal disclaimer: The content of this material is a marketing communication, and not independent investment advice or research. The material is provided as general market information and/or market commentary. Nothing in this material is or should be considered to be legal, financial, investment or other advice on which reliance should be placed. No opinion included in the material constitutes a recommendation by Tradestone Ltd or the author that any particular investment security, transaction or investment strategy is suitable for any specific person. All information is indicative and subject to change without notice and may be out of date at any given time. Neither Tradestone Ltd nor the author of this material shall be responsible for any loss you may incur, either directly or indirectly, arising from any investment based on any information contained herein. You should always seek independent advice suitable to your needs.

Bill Williams is the creator of some of the most popular market indicators: Awesome Oscillator, Fractals, Alligator, and Gator.

Trend strategies are good - they may give significantly good results in any time frame and with any assets. The main idea of the ADX Trend-Based strategy is to try to catch the beginning of the trend.

Counter-trend strategies are always the most dangerous but also the most profitable. We are pleased to present an excellent counter-trend strategy for working in any market and with any assets.


Your request is accepted.
We will call you at the time interval that you chose
Next callback request for this phone number will be available in 00:30:00
If you have an urgent issue please contact us via
Live chat
Internal error. Please try again later