


Williams’ Strategy
Bill Williams is the creator of some of the most popular market indicators: Awesome Oscillator, Fractals, Alligator, and Gator.

Don’t waste your time – keep track of how NFP affects the US dollar!
Data Collection Notice
We maintain a record of your data to run this website. By clicking the button, you agree to our Privacy Policy.

Beginner Forex Book
Your ultimate guide through the world of trading.

Check Your Inbox!
In our email, you will find the Forex 101 book. Just tap the button to get it!
Risk warning: ᏟᖴᎠs are complex instruments and come with a high risk of losing money rapidly due to leverage.
70.72% of retail investor accounts lose money when trading ᏟᖴᎠs with this provider.
You should consider whether you understand how ᏟᖴᎠs work and whether you can afford to take the high risk of losing your money.
Warning! Old version of the browser!
Press one of the icons below to proceed to the official website of the developer and download the latest version of your browser.

Online Forex broker
2020-03-25 • Updated
Information is not investment advice
We are sure that you are familiar with technical analysis and trend lines in particular. In this case, you know that the trend-building carries a lot of subjectivity involved. Today we will explain to you the methods of trend-constructing and trend-trading by famous trader Victor Sperandeo, also known as “Trader Vic”. Together with Mr. Sperandeo, we will learn how to make trendlines work for you.
Who is Victor Sperandeo?
Trader Vic is a US trader, index developer, and financial commentator. He is known for trading commodities in the energy and metals sectors. An interesting fact: he predicted the stock market crash of 1987 (Black Monday). Before the crash, Victor Sperandeo shorted the Dow index and made 300% during a day.
The outstanding trading abilities of trader Vic helped him to create many useful and profitable strategies and techniques, which are relevant until now. The famous trendline method that we are going to explain to you below is one of them.
The trend-trading method by Trader Vic
Let’s consider the very simple method for trend trading described by Mr. Sperandeo. It is called “changing trends in the one-two-three”. Of course, it starts with the construction of a correct trendline.
From the basics of technical analysis, you remember that you need to draw a line between at least two points. If you consider an uptrend, you see a series of higher highs and higher lows. Alternatively, a downtrend is a series of lower lows and lower highs.
So, you opened a chart in MT4, and faced with the first problem: there are too many lines that you can potentially consider as “trendlines”. But which one of them is the right one? Let’s look at the algorithm of determining a good working trend by Trader Vic.
Let’s look at the step-by-step representations. Firstly, we will start with building an uptrend.
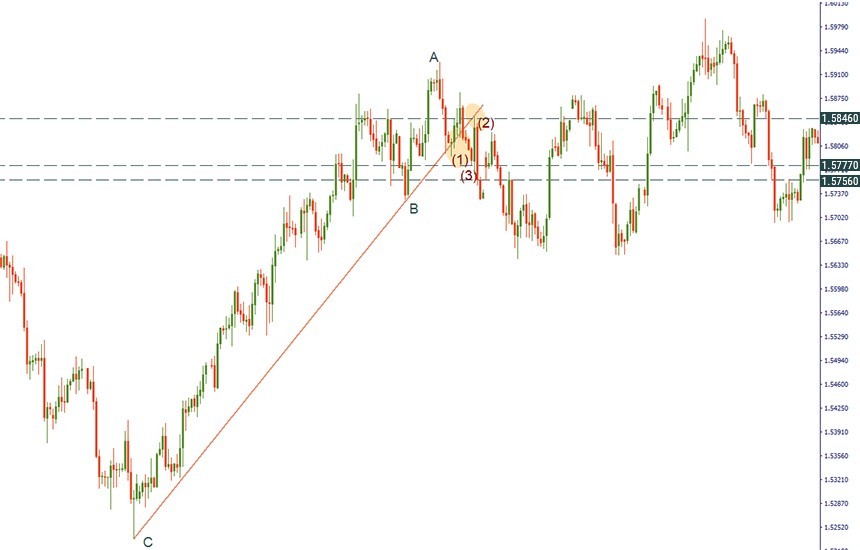
The uptrend is established. So, what should you do next? Let’s look at the picture below to understand the “one-two-three” method by Victor Sperandeo.
We can see an uptrend formed on the 4-hour chart of GBP/USD. After passing the “A” point, the trendline touched the price. It signaled about the change of a trend. The breakout of the trendline to the downside is called “one” (1) by trader Vic. After that, the price rises and retests the trendline. This is second (2) necessary condition of the reversal. At the same time, the low before the candlestick which caused a retest is considered as a level which needs to be broken to confirm the reversal. Thus, the break of the 1.5777 level is the third condition (3), after which we may open a short position. In our example, we opened a short position at the closing price of a candlestick after point (3) at 1.5756. Stop loss will be placed at the point (2), but the level of take profit needs to be trailed.
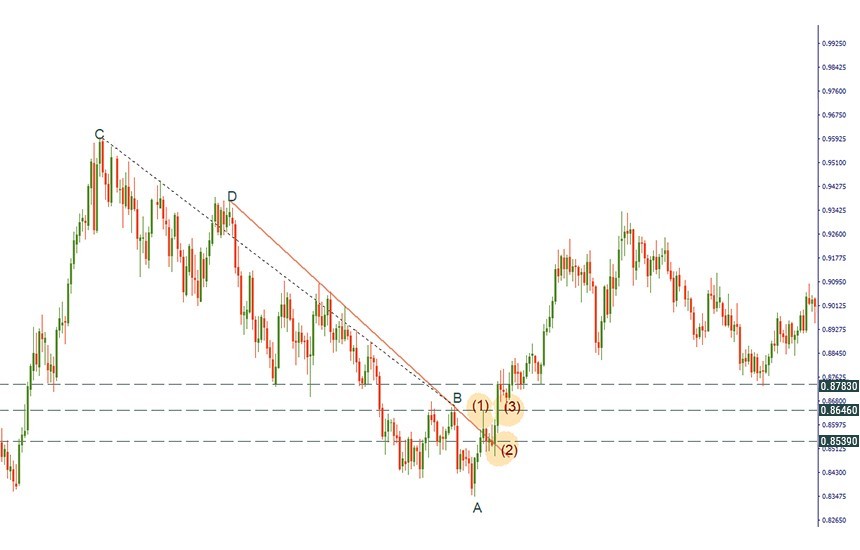
Now, let’s look at the scenario with a downward trend.
Now we are ready for some trend trading! After the price crossed the trendline (1st condition), we wait for the retest of the trendline. The high before the candlestick which caused a retest is considered as a level which needs to be broken to confirm the reversal. That means, the break of the 0.8646 level is the third condition (3), which may be considered as a signal to open a long position. On the picture below, we opened a position at the closing price of the candlestick after point (3) at 0.8738. Stop loss will be placed at the closing price of the candlestick, which caused a breakout at 0.8539. As for the level of take profit, we trail it.
Conclusion
Today we learned some tips on trend-construction and trading by the famous Trader Vic. Although the strategy seems easy, it requires practice and the knowledge of the basics of technical analysis.

Bill Williams is the creator of some of the most popular market indicators: Awesome Oscillator, Fractals, Alligator, and Gator.

Trend strategies are good - they may give significantly good results in any time frame and with any assets. The main idea of the ADX Trend-Based strategy is to try to catch the beginning of the trend.

Counter-trend strategies are always the most dangerous but also the most profitable. We are pleased to present an excellent counter-trend strategy for working in any market and with any assets.


Your request is accepted.
We will call you at the time interval that you chose
Next callback request for this phone number will be available in 00:30:00
If you have an urgent issue please contact us via
Live chat
Internal error. Please try again later