


Williams’ Strategy
Bill Williams is the creator of some of the most popular market indicators: Awesome Oscillator, Fractals, Alligator, and Gator.

Don’t waste your time – keep track of how NFP affects the US dollar!
Data Collection Notice
We maintain a record of your data to run this website. By clicking the button, you agree to our Privacy Policy.

Beginner Forex Book
Your ultimate guide through the world of trading.

Check Your Inbox!
In our email, you will find the Forex 101 book. Just tap the button to get it!
Risk warning: ᏟᖴᎠs are complex instruments and come with a high risk of losing money rapidly due to leverage.
70.72% of retail investor accounts lose money when trading ᏟᖴᎠs with this provider.
You should consider whether you understand how ᏟᖴᎠs work and whether you can afford to take the high risk of losing your money.
Warning! Old version of the browser!
Press one of the icons below to proceed to the official website of the developer and download the latest version of your browser.

Online Forex broker
2020-03-25 • Updated
Information is not investment advice
Some traders prefer to trade on the longer-term timeframes. It helps them to check the positions no more than once a day and have more time for making a final decision. However, if you prefer to be a more aggressive trader and earn money within a day, you will probably try trading on the H1 and H4 charts. In this article, we will explain the most popular strategies for this kind of trading.
Advantages and disadvantages of trading on the smaller timeframes
There are pros and cons of trading on the smaller timeframes. Among the advantages, we can mention lower pressure on the investor’s deposit and the possibility of earning more money due to the increased number of opened positions.
At the same time, there are certain disadvantages in trading on H1 and H4. The first one is, of course, the increased amount of time you need to spend in front of the trading platform. Also, take into account that the emotional pressure is higher while trading on the smaller timeframes. Thus, the strategies for intraday trading must be simple in their usage, but effective at the same time.
Strategy for trading on the H1 chart
You need to apply several moving averages to the chart to implement the following trading strategy.
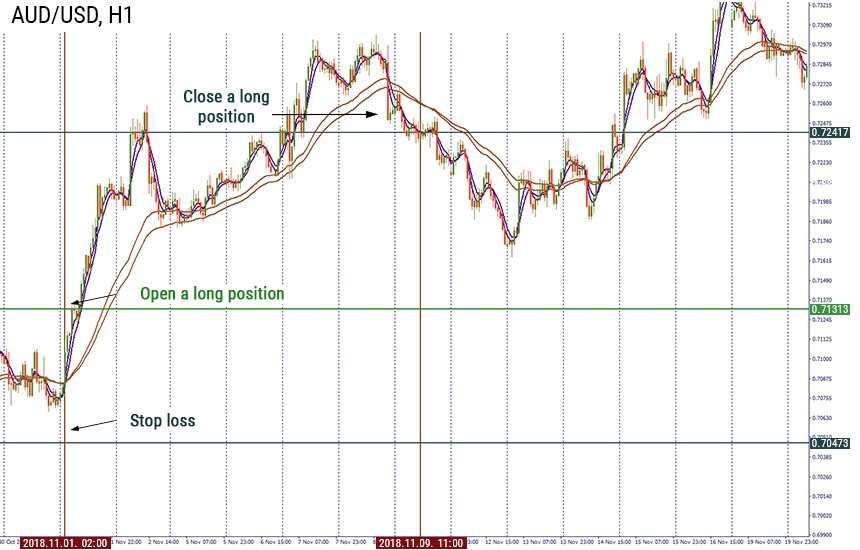
The rule is simple. When the linear weighted MAs cross the exponential MAs upside down, it signals us to open a short position. Alternatively, when the linear weighted moving averages cross the exponential ones from bottom to top, we may open a long position. Signal will be stronger if the distance between two linear weighted moving averages is lower or they cross each other. At the same time, the bar of the candlestick following the crossover should close below the crossover (if it’s a signal for the short position) or above the crossover (if it’s a signal for the long position).
You close your position when the exponential MAs cross each other.
Let’s consider the example.
On the H1 chart of AUD/USD linear weighted MAs crossed exponential MAs from bottom to top on November 1. We waited for the candlestick to close above the moving averages and the levels of the previous consolidation. After that, we waited for the next candlestick and opened a long position at its closing price at 0.7131. Our stop loss is placed below the levels of consolidation at 0.7047. We waited for the exponential MA to cross each other at 0.7242. We earned 111 pips (0.7242-0.7131).
Strategy for trading on the H4 chart
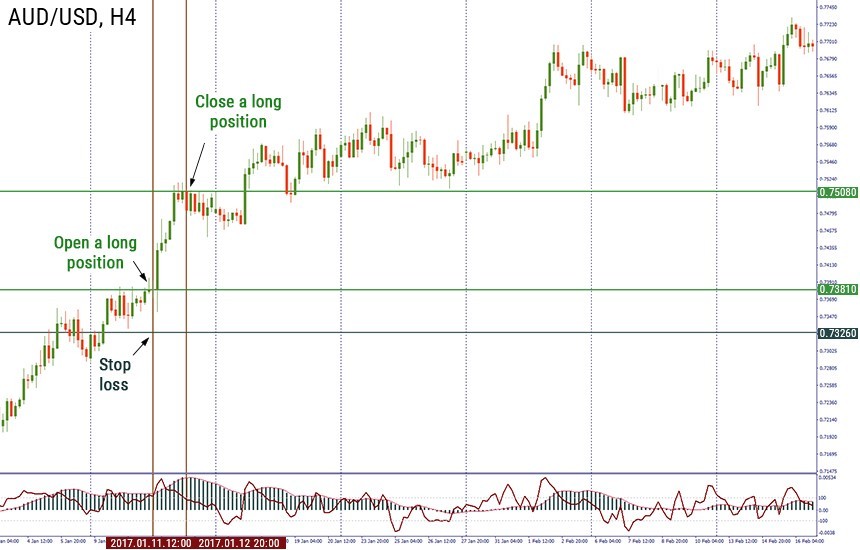
The strategy described below requires the usage of two indicators: MACD with settings 12,26,2 and Commodity channel index (CCI), which period equals 14.
You need to open a long position when:
We place our stop loss here below the levels of the previous consolidation. Our take profit depends on price action. However, we must close our position if CCI falls below the 100 level.
Let’s look at the H4 chart for AUD/USD.
On January 11 we saw the CCI rising above the MACD. We waited for the next candlestick and opened the position at 0.7381. Our stop loss is placed below the levels of the previous consolidation at 0.7326. We closed the position when CCI tested the 100 level upside down at 0.7508. As a result, we earned 127 pips.
When should you open a short position?
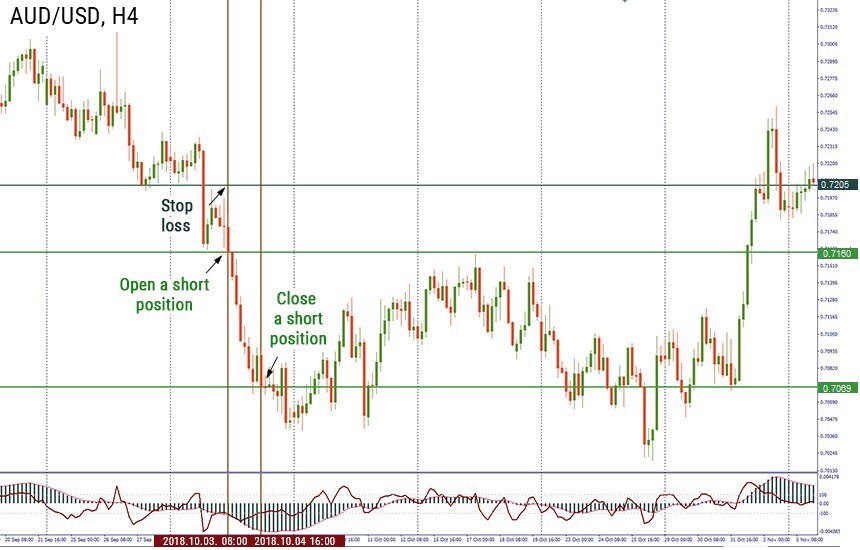
Finally, let’s consider the example of the short position on the same H4 chart for AUD/USD.
CCI crossed MACD upside down. We opened a short position at 0.7160. Our stop loss is placed above the levels of the previous consolidation at 0.7205. We waited until CCI tested the -100 level and closed the position at 0.7069. We earned 91 pips.
Conclusion
Trading on the smaller timeframes may provide you quicker profits. At the same time, it requires a lot of attention that is why you need to be careful while trading on them.

Bill Williams is the creator of some of the most popular market indicators: Awesome Oscillator, Fractals, Alligator, and Gator.

Trend strategies are good - they may give significantly good results in any time frame and with any assets. The main idea of the ADX Trend-Based strategy is to try to catch the beginning of the trend.

Counter-trend strategies are always the most dangerous but also the most profitable. We are pleased to present an excellent counter-trend strategy for working in any market and with any assets.


Your request is accepted.
We will call you at the time interval that you chose
Next callback request for this phone number will be available in 00:30:00
If you have an urgent issue please contact us via
Live chat
Internal error. Please try again later